The US GDP growth was up by 0.54% at annual rate during the first quarter of 2016 after 1.4% for the last three months of 2015.
Compared to the first quarter of 2015, the economic activity was up by 1.95% and the carry over growth for 2016 at the end of the first quarter was 0.88%. To get the same economic performance (growth rate at 2.4%) than in 2014 and 2015, GDP should grow at a 4% pace during the last three quarters of 2016. That’s probably too much and that why we expect a growth rate below 2% for 2016.
The explanation of the growth slowdown of the first quarter is a lower momentum for the internal demand and a negative contribution from next exports. The consumption expenditures’ contribution is weaker than in Q4 2015 while residential investment was stronger. Companies’ investment was lower and has contributed negatively (for both productive investment and investment in structures)
I have put charts in order to understand the dynamics of the US economy.
First Graph
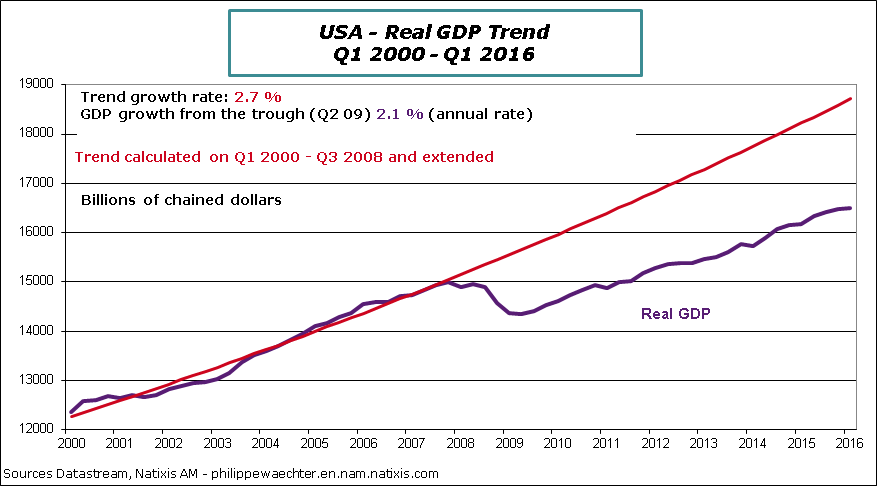
The growth trend for the US GDP is currently lower than it was before the crisis. The pre-crisis trend is in red and its growth was 2.7% per annum. Since the start of the recovery (Q2 2009), GDP is up by 2.1% per annum. We clearly see the divergence between the two on the graph.
Second Graph
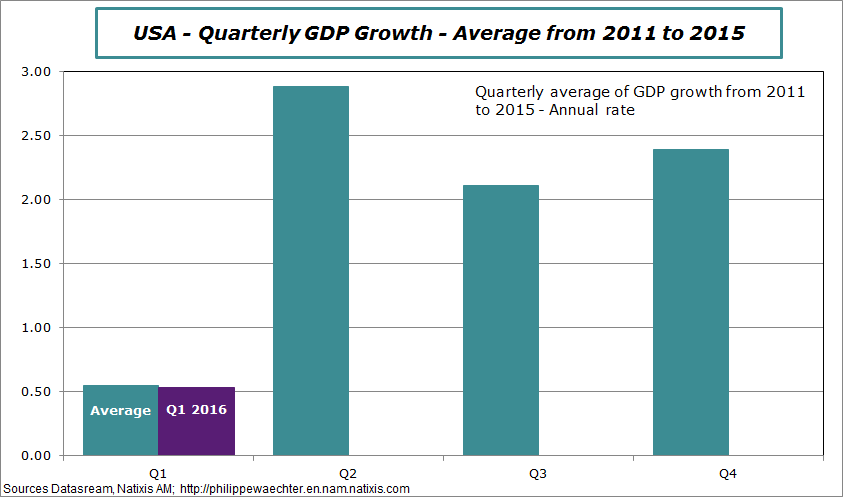
On average during the period 2011-2015 the first quarter growth was close to 0.5%. It was almost the same figure for the first quarter of 2016. The main question is to know if the catch up usually seen during the second quarter will effectively be there. That’s an important question, notably for monetary policy.
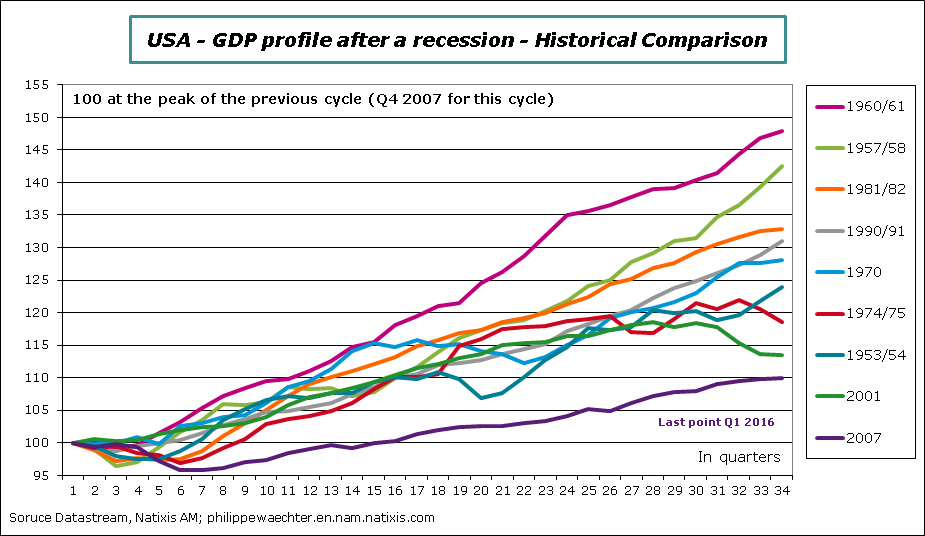
Third Graph
The current business cycle is the weakest since WWII.
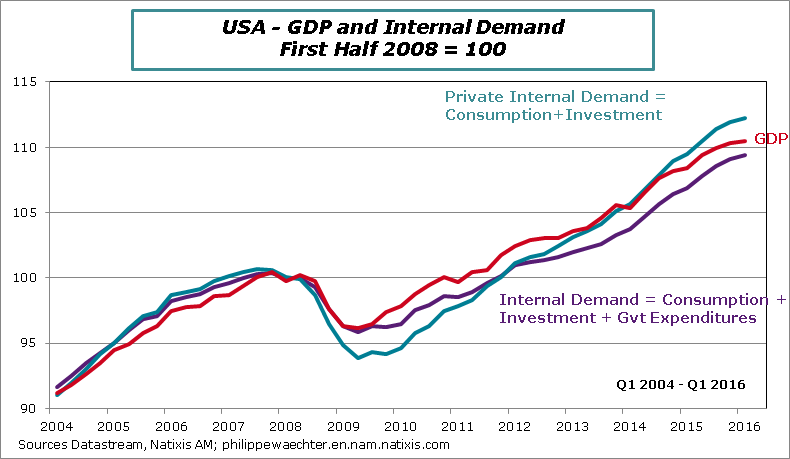
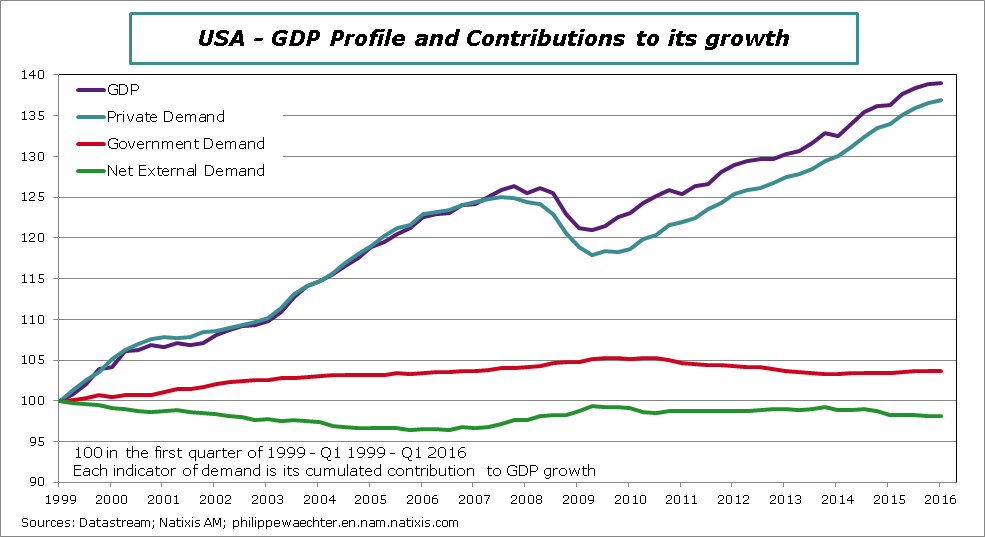
Fourth and Fifth Graphs
Internal demand is the main support for the GDP growth (it seems trivial but it is not when you look at Germany). The fourth graph shows the internal demand profile based at 100 during the first half of 2008 (before the Lehman moment). We see that the private internal demand is stronger than when government expenditures are added.
On the fifth graph I have made a decomposition of each component’s contribution to GDP growth. Private demand is a strong and the main support for growth while net exports has systematically a negative contribution. Since 2010/2011 government expenditures have been a drag on GDP growth.
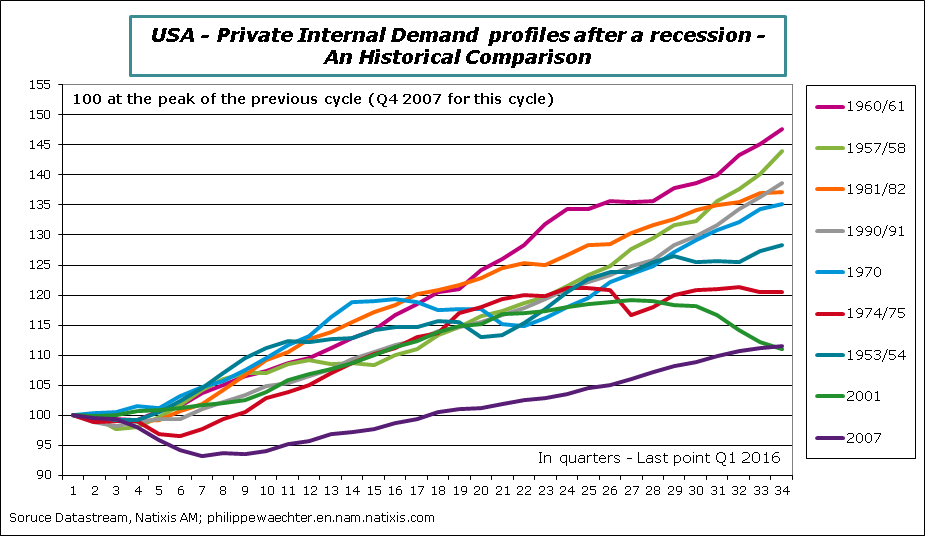
Sixth and seventh graphs
The private internal demand is the main support for growth. But when we compare the private internal demand cycle since WWII we notice that the current profile is the weakest. Consumption expenditures follow a lower trajectory and investment lacks of momentum.
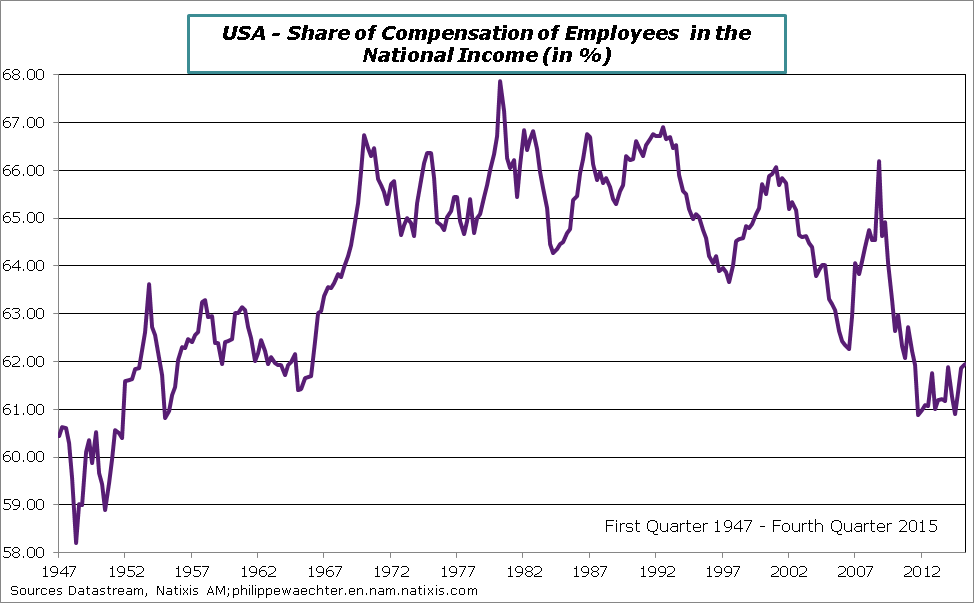
I think that one major explanation is income distribution between companies and employees. The compensation’s share in the US national income has decreased rapidly during the last decade. On the contrary, companies’ share has increased rapidly but this income was not a resource for investment. It has helped to increase dividends and shares buyback (with a strong leverage at the same time).
For households, the income momentum has been lower and so its consumption dynamics has been weaker. As consumption is about 70% of GDP, the growth momentum was lower.
I am convinced that this change in income distribution is partly an explanation for the current weak growth but also of the deep polarization on political issues seen during the current presidential campaign.