Branko Milanovic (@BrankoMilan) shows, with a simple graph, one of the most important change seen since the end of last century. His question was related to real income distribution but not in a country but at a global scale from 1988 to 2008.
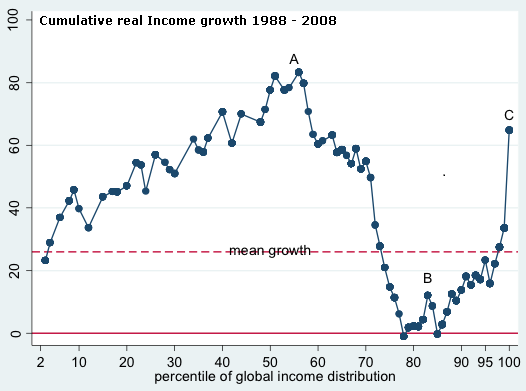
He has calculated the income growth on this period for each percentile of the global income distribution.
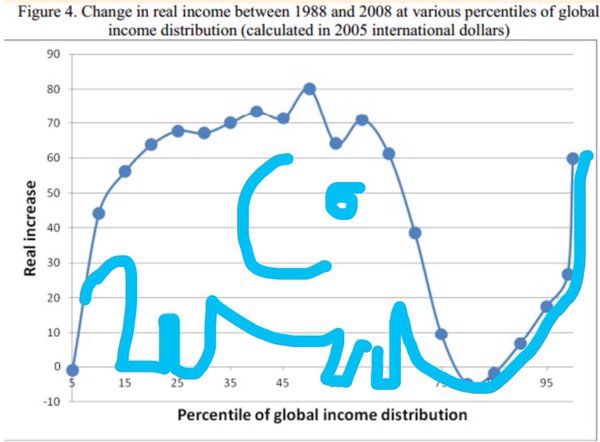
The graph is shown below and looks like an elephant (see at the bottom of the post)
Three points to be mentioned
People leaving close to the median (point A), mainly Chinese and Indian, have income that grown by circa 80% from 1988 to 2008. This is absolutely spectacular on such a short period of time.
On the contrary, people at point B have had at best stagnant real revenues. These people belongs to the lower halve of the income distribution in developed countries. The immediate question is whether the improvement seen in A is the counterparty of B? In other words, is there a trade off for income between emerging and developed countries at the expense of the latter? Could be, that’s the type of answer that is given by David Autor ( @davidautor )
Point C corresponds to the highest percentile, mainly American people.
The effects of trade, or more broadly of globalisation, on incomes and their distribution in the rich countries have been much studied, beginning with a number of works on wage distributions in the 1990s, to more recent papers on the effects of globalisation on the labour share (Karabarbounis and Neiman 2013, Elsby et al. 2013), wage inequality (Ebenstein et al. 2015), and routine middle class jobs (Autor and Dorn 2010).
In joint work with Christoph Lakner (Lakner and Milanovic 2015) and in a recently published book, Global Inequality: A New Approach for the Age of Globalization (Milanovic 2016), I take a different approach of looking at real incomes across the world population. This is made possible thanks to the data from almost 600 household surveys from approximately 120 countries in the world covering more than 90% of the world population and 95% of global GDP. Since household surveys are not available for all countries annually, the data are ‘centred’ on benchmark years, at five-year intervals, starting with 1988 and ending in 2008. I report the results for up to 2011 in Milanovic (2016), while Lakner has an unpublished update for 2013. The updates confirm, or reinforce, the key findings for 1988-2008 that I discuss here.
The advantage of a global approach resides in its comprehensiveness and the ability to observe and analyse the effects of globalisation in many parts of the world and on many parts of the global income distribution. While the true or putative effects of globalisation on working class incomes in the rich world have become the object of fierce political battles – especially in the wake of the Brexit vote and the rise of Donald Trump to political prominence in the US – the overall effects of globalisation on the rest of the world have received less attention, and when they have, were studied separately, as if independent, from the effects observed in the rich word.
Continue reading The greatest reshuffle of individual incomes since the Industrial Revolution

Philippe Waechter's blog My french blog


