
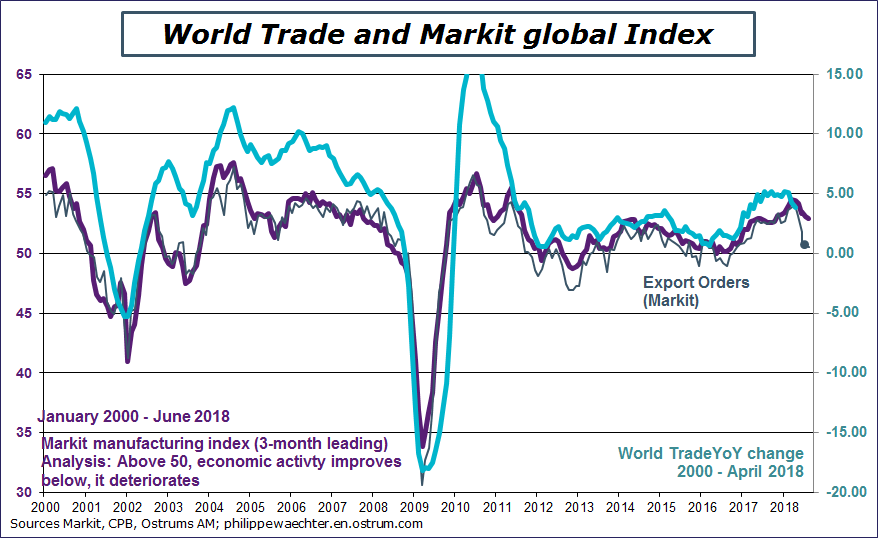
The economic environment is changing. The world Markit index level in the manufacturing sector is still showing growth (index at 53 above the threshold of 50) but it is trending downward since the peak of December 2017.
This new pace can be seen on the graph below where the world index, with a 3-month lead, is compared to the world trade yearly change. The consistency seen between the 2 suggests that world trade will falter in coming months.
I have added the new export index on the graph. It shows a rapid decline in May and June, probably a consequence of the uncertainty on world trade after the White House decisions on tariffs. The short term dynamics on the economic activity may be lower than expected.
The lower momentum of the global economic activity can be explained by three reasons:
1 – For many countries, the momentum was close to their speed limit at the end of 2017. Since the beginning of the year, the lower dynamics reflects the search for a more sustainable growth trajectory. This is applicable to the Euro Area and Japan. For the United Kingdom, a important explanation is the aftermath of the referendum as I mentioned it here.
2 – The strong growth at the end of 2017 has increased the demand for oil, pushing the price on the upside. During the first three months of 2018, the average price was 67 USD versus 55 last year on the same period (+22%). The higher price was just a consequence of a more rapid global growth.
The price profile has changed with the announcements of US sanctions against Russia and Iran. In June the oil price was 76 USD on average. This political premium is a source of constraint as oil is more expensive and of uncertainty for the business sector. The move on the OPEC side, to increase the production, is not sufficient as the White House wants to ban Iranian oil exports. 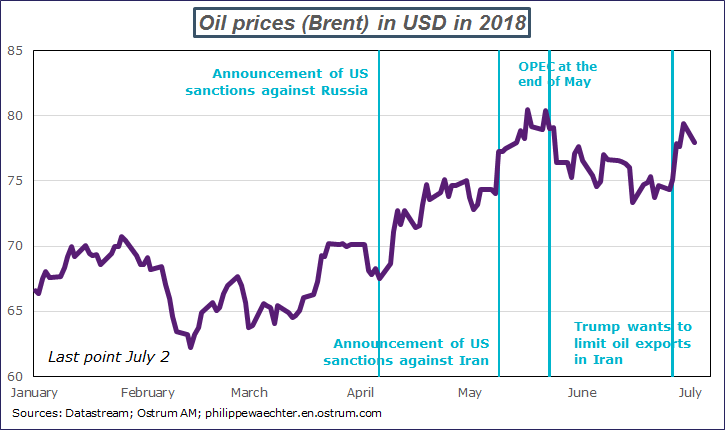
3 – The political environment also implies more uncertainty. The rise in populism started in 2017 but its development is seen in 2018 with measures on refugees and on world trade at the White House, with elections and a populist government in Italy and now with a risk on the German coalition. Who is going to take the risk of investing in means of production when the political situation appears so blurred.
We see on the graph below that the peak was seen at the end of 2017.
The speed limit argument for the Euro Area is clearly perceptible. The capacity utilization rate in the industrial sector was at a very high level and hiring people is tough. The Euro Area was not able to go faster. It will be more sustainable with a lower growth. It will not create disequilibrium.
Emerging countries are no longer a source of impulse for the rest of the world economy. The peak was also at the end of last year. This trend will continue as the situation has changed in emerging countries since mid-April and the surge of the US dollar (see here). Their outlook is weaker now and emerging countries will not be a strong source of impetus in coming months. China will be a source of stabilization not a source for a stronger momentum.
The only exception is the US economy. The ISM index is at a very high level as is the US Markit index even if the two profiles are not always consistent on with each other. This divergence with the rest of the world reflects the strong support of the US fiscal policy. Domestic demand is strong and this can be seen with a high supply delivery index in the ISM survey. This shows that companies face a very strong demand and that they have not the capacity to respond to it. This too accommodative policy mix when the US economy is at full employment is the main reason a tighter monetary policy in coming weeks and months. This will limit the possibility of large imbalances.
The graph below aggregates all these information.

In coming weeks, risks of a more severe slowdown are high as political uncertainty will remain high on both side of the Atlantic. Higher tariffs proposed by the White House will lead to retaliation from China, Europe and Canada at least. This will have the effect of throwing a handful of sand into the mechanisms of world trade. Every country will be penalized by these developments. The momentum in emerging countries will be lower as their adjustment is far from being close to its end as the Fed has not finished its monetary policy tightening.
The dynamics pf the world economy has dramatically changed since the end of last year. This will not speed up the monetary policy normalization in Europe.