Emmanuel Bourdeix is the co-Chief Investment Officer at Natixis Asset Management and in charge of Seeyond. He has accepted to share on this blog his interpretation of the strong volatility movements seen on equity markets in August. I’m pleased to invite you to read his posts.
There has not been such fear in equity markets of developed countries since the crises in 2008 and 2011: are we dealing with a simple normalisation of risk, or an exaggerated movement?
While the markets were trying to take a breath after their second-quarter peaks and had consolidated rather quietly until then, the devaluation of the Chinese currency and the associated fears that the Chinese economic slowdown could spread to the rest of the planet triggered a sudden fall in equity markets worldwide.
The Eurostoxx50 fell by 1.88% already on Wednesday, August 19th and – like the other European markets – it posted four consecutive days of increasingly steep declines. On Monday, August 24th it dropped by 5.35% in one trading session, the largest fall since August 2011. Investors, who had become used to volatilities being at low levels by accommodating monetary policies conducted by the main central banks in the last few years, panicked.
Are there actual reasons to be concerned about these movements or is this a simple normalisation of risk?
Let us take the example of the S&P500, which fell by 3.94% in one trading session on Monday, August 24th. For illustration purpose and to reflect reality, while investors expected a volatility of 16% for the US index the previous week, i.e. daily fluctuations of close to +/-1%, Monday’s fall was close to four times the expected daily standard deviation. A normal distribution modelling of returns shows that a trading session like Monday’s can statistically occur only once each 20,000 business days. It means that such a daily shock can be seen on average once every 81 years of equity market activity. From this perspective, i.e. under this less than cautious volatility hypothesis, there are actually reasons to be concerned. Conversely, if investors had expected a somewhat more “normal” volatility, for example of 24%, they could have estimated that this type of trading session can occur every 211 trading sessions: this is not that unlikely, and in any case it is more realistic.
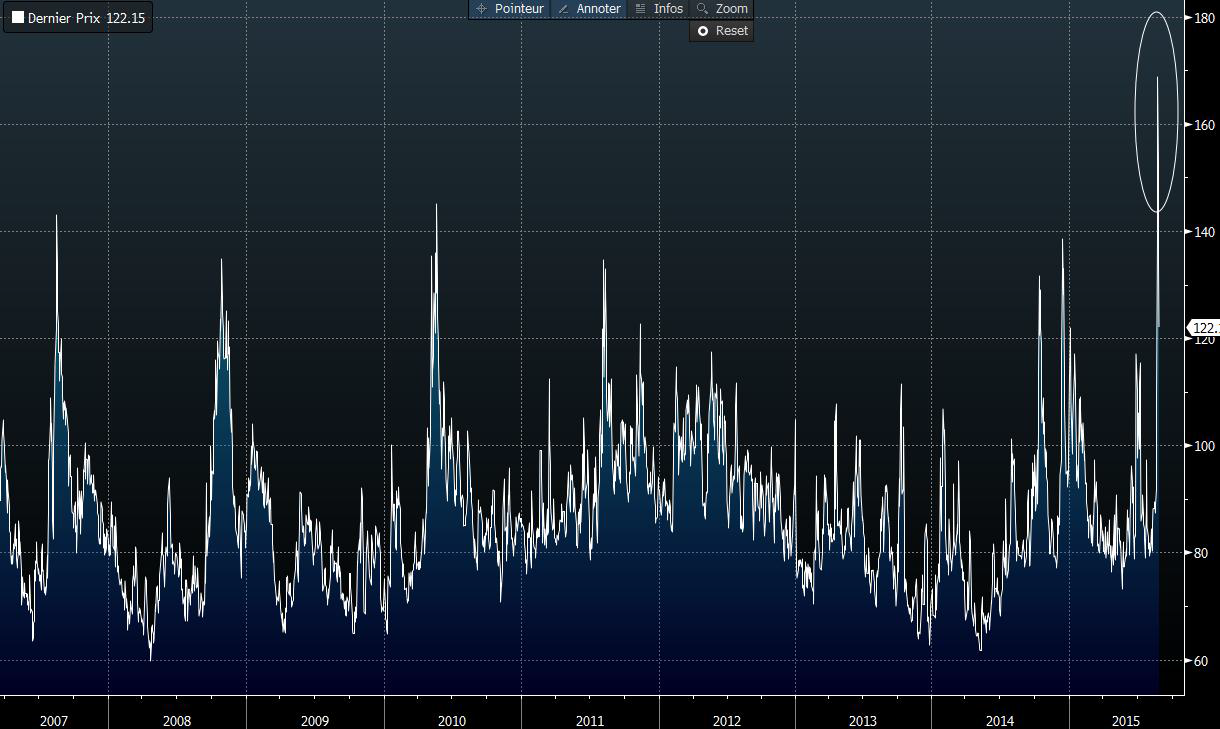
Is this confirmed by the VIX market, a representative index of expectations of S&P500 volatility for the coming month? The VIX is nicknamed the “fear index” as it tends to rise sharply when markets panic. While it had stayed in the 12-16% area since early August, it suddenly surged towards 40% before consolidating towards the 25-30% area, i.e. levels that remain close to the last significant volatility peaks in 2010 and 2011, but far from the 2008 records when it approached 80%. More than the absolute level the VIX reached, it was the speed with which it took off that seemed abnormal: it doubled in three days and almost tripled in four days, which is unprecedented. Even in 2008, the violence of the shock did not reach such summits.
This is seen even more clearly in the historical chart of VVIX index, which represents the VIX volatility itself (source Bloomberg):

And this is not due to a lack of liquidity since, as we have seen during previous crises, volumes in the VIX futures and options market increased drastically. During the VIX trading session on Monday, August 24th, a notional amount of around $20 billion was traded in the three first monthly VIX futures contracts. Furthermore, there was no major break in the economic fundamentals that can explain this level of jitters.
We believe this behaviour is rather an indicator of the technical character of the correction underway. It is the unfortunate consequence of the ultra-accommodating monetary policies conducted worldwide over the past four years which, by flooding markets with cheap and abundant liquidity, have forced investors to behave in a herd-like, extreme and not sufficiently heterogeneous manner in the same asset classes, while searching for returns that have disappeared from bond markets as interest rates have fallen. It only takes a spark like the announcement of the devaluation of the yuan to trigger drastic – or even statistically unlikely – market turnarounds.
Seven years after the 2008 financial crisis, the so-called “wild hazard” roams around markets, even though accommodating monetary policies were thought to have a stabilising effect.
Written on August, 28th 2015.
Emmanuel Bourdeix
Co-CIO NAM
In charge of Seeyond
Definitions:
Volatility: Magnitude of variation for a security, fund, market or index over a defined period. A high volatility means that the security’s price varies meaningfully, and thus that the risk associated with the security is high.
EuroStoxx 50 index: Index comprising 50 large European companies selected among the Euro zone countries. The index is available on the following website: www.stoxx.com
S&P 500 index: Index mainly comprising large capitalizations (around 500 stocks). It is the most representative index of the US market. The index is available on the following website: http://us.spindices.com/
Accommodating monetary policy: Measures taken by a central bank consisting in expanding the money supply and maintain interest rates at low levels to boost the economy. By encouraging loans and offering cheaper funding to businesses and to consumers, the central Bank thus hopes to encourage more spending.

Philippe Waechter's blog My french blog

