The GDP growth figure was 1.7% in 2016 for the Euro Area. It is interesting to compare this performance to other large countries in the world. Four graphs can give landmarks on the relative robustness of the Euro Area compared to its main partners and competitors.
In an absolute measure, it is far from having the best performance but since the crisis growth trends have changed. The gap between the current GDP level and the pre-crisis trend is larger in the US and in the United Kingdom than in the Euro Area. This latter felt but from a lower point than the anglo-saxons countries. The detail of the Euro Area is still problematic as momentums of Italy, Portugal and Greece are still far from what is observed elsewhere.
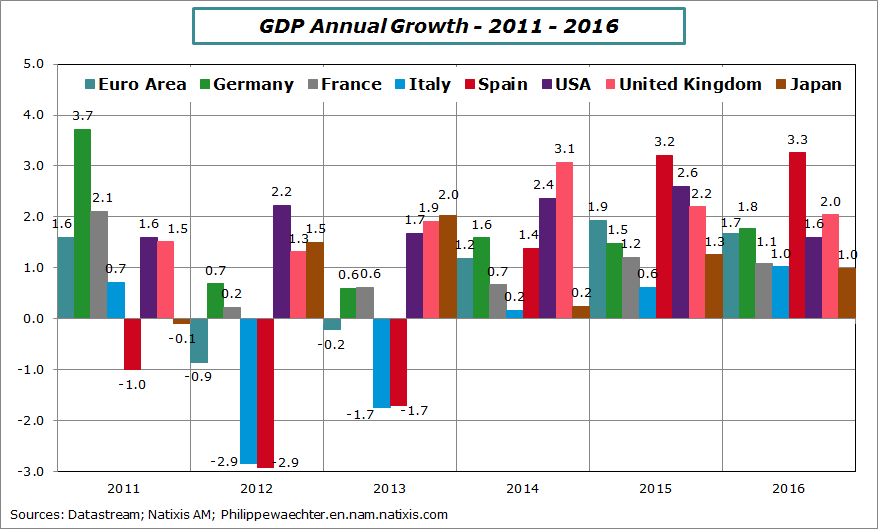
The first graph shows the annual growth for large developed countries since 2011 (I start with 2011 because from this date the impact of fiscal measures taken just after the 2008 crisis have almost totally vanished).
We see the relative stability of the growth dynamics in the US and the United Kingdom even if the 2016 growth figure for the US is the weakest since 2011. In 2013, the Japanese growth jumped after the adoption of supportive fiscal and monetary policies. It was just before the VAT rate hike of April the 1st 2014 that pulled down economic activity.
In the Euro Area, the 2011-2012-2013 period was particularly difficult notably in Spain and Italy. It is associated with austerity policies. Fiscal policies have been too restrictive and monetary policy was too restrictive especially after the two rates’ hikes in April and July 2011.
Since 2014 Spain recovers but the situation is still weak in Italy. France remained behind Germany at the exception of 2013.
For the Euro Area, there is a break with a mild recovery after 2014 and in 2016 its growth was higher than in the US.
The recent performance in Europe reflects economic policies’ stability. Fiscal policy stance is stable and almost neutral and monetary policy is accommodative and perceived as maintaining this stance for a extended period. Companies and households can behave with constraints that depend only of their own environment (not on expected fiscal shock). Moreover the low interest rate, low oil price and lower euro were positive for business.
Figures above bars are GDP growth
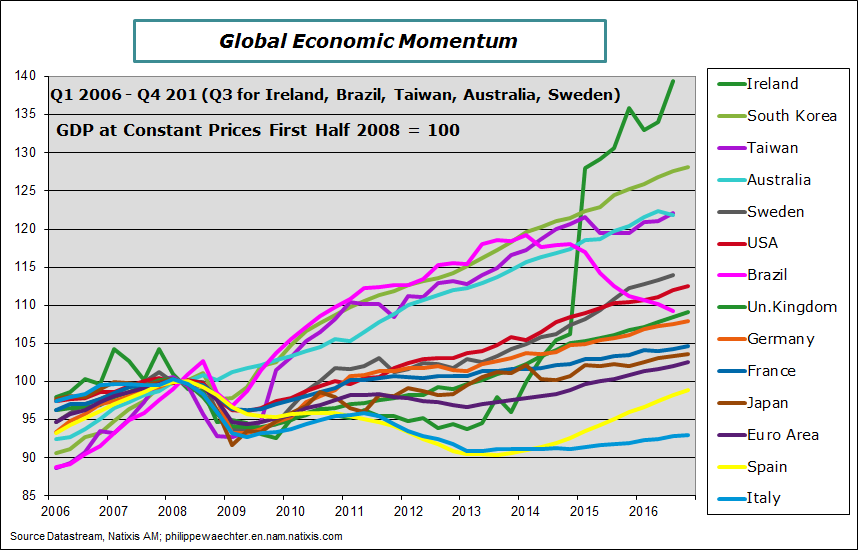
The second graph includes new countries like Taiwan, South Korea, Brazil, Sweden and Australia. I have added Ireland for the Euro Area. The graph shows GDP profiles scaled at 100 in the first half of 2008 (before the Lehman moment).
This graph shows GDP profiles since the crisis.
The first point to mention is that neither Spain nor Italy have recovered from the 2008 crisis. The level of their GDP is still below their pre-crisis level.
Ireland has recovered at a rapid pace after 2014 due to improved conditions in the Euro Area, lax monetary policy and Ireland has taken advantage of a small but very open economy.
Asia is the region with the strongest momentum. South Korea, Taiwan and Australia are on a robust trend. This is consistent with what we see elsewhere: growth is in Asia (see here a post in French on the location of production). Sweden has had a stable recovery due to a very accommodative monetary policy.
The most surprising country is Brazil. It was the leader, on my graph, until 2014. Now its trajectory is weakening very rapidly and I don’t see a reason to stop the fall.
Large countries of the Euro Area are below the US and the United Kingdom. We see on the graph that Euro countries are behind all others except Japan.
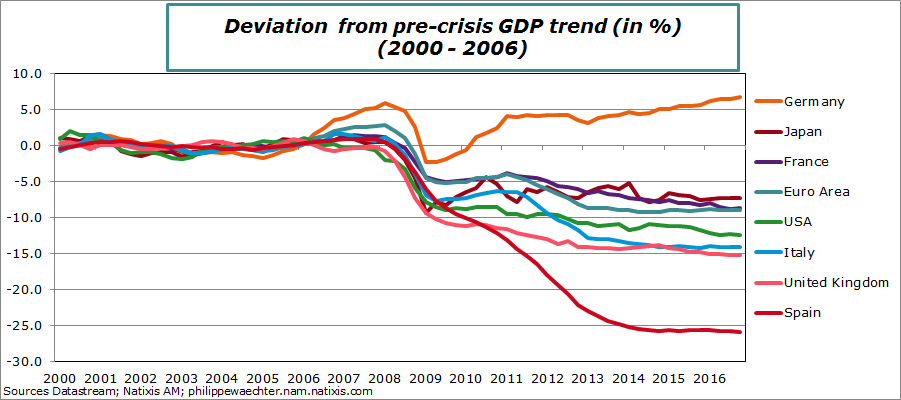
The third graph shows the gap between current GDP level and GDP trend before the crisis. The trend is calculated from 2000 to 2006. I have excluded 2007 as usually before a crisis there is an acceleration of the activity that could have a impact on the real measure (see here for a justification). The number of countries is limited in order to ease the reading.
The perception of the business cycle is very different with this treatment of the data.
First Germany has a very different profile than any other country. Its GDP is permanently above its pre-crisis trend. Germany is doing better than any other country. The gap is positive at almost 7%. If Germany had followed its pre-crisis trend, its current GDP would be 7% below its observed level. So it is not surprising that the labor market outperforms all the others in the EUro Area. The current unemployment rate is the lowest since the reunification in 1991 (5.9%).
For all the other countries the gap is negative. The most spectacular country is Spain with a gap close to 25%. The current GDP is 25% below the level it would have had if it had followed the pre-crisis trend. That’s huge.
Japan, France and the Euro Area are doing better than the US and the United Kingdom. The trend was stronger before the crisis in Anglo-saxons countries. So with mild recoveries the gap is larger than in countries were the pre-crisis trend was weaker.
The performance of the Euro Area and of Japan is not that bad compared to the pre-crisis trend even if the absolute result is not satisfying. In other words, the drop was limited because the starting point was lower. I am not sure that is it very positive.
In other words, the opportunity cost of the crisis has been higher in the Anglo-saxons countries.
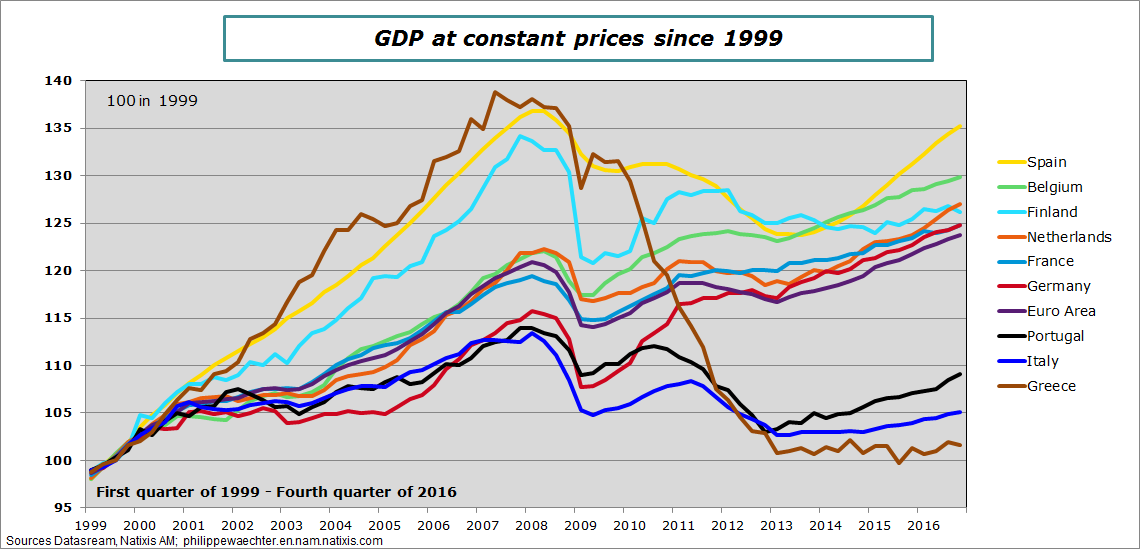
The fourth graph shows the GDP level in the Eurozone since its inception.
With this metric, Spain has had the strongest performance on the whole period. We clearly see three sub-periods. We clearly see the impact of the austerity policy. Spain is a group of countries that recovered mildly but with a positive trend.
This is not the case for three countries. In Italy, Greece and Portugal the negative shock has been persistent. Italy and Portugal had weak performances before the crisis but the adjustment shocks after the crisis have had dramatic effects. The break has been long and the recovery is far from what is seen in other countries of the Eurozone. The question is how to change this trend in the current institutions. Saying it differently, we cannot expect, with the current institutions, a convergence to the eurozone trend in a finite time.
The last country is Greece. It was the best performer before the crisis and is now the worst. How can this country recover if its public debt is not restructured? It is impossible

Philippe Waechter's blog My french blog


