The hefty fiscal stimulus in the US involving a rise in spending (1% of GDP in 2018 and 2019) and the implementation of tax cuts should be seen as a shock for the international economy. The uniformity of economic policy across developed countries, which acted as the driver for the growth recovery witnessed since 2017, is now just a distant memory.
Fiscal policy in the US will clearly trigger an adjustment between economic blocks and particularly between the US and the euro area and this will necessarily involve the exchange rate. The greenback has so far tended to lose value, regardless of whether we look at the effective exchange rate (nominal or real) or the dollar/euro rate.
The big question now is the dollar’s trend over the months ahead. Will the greenback gain value or must it inevitably fall as a result of the imbalances triggered by policy from the White House and Congress?
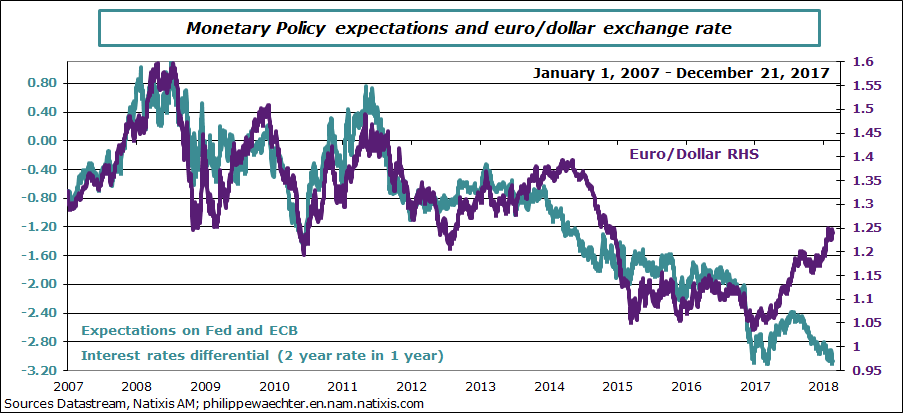
There has been something of a logic in the trend between monetary policy expectations in the US and the euro area, and the euro/dollar exchange rate since 2007. Expectations of more restrictive monetary policy in the US led to gains for the dollar right throughout this period, as shown by the chart below. However, we can see that since the Fall of 2017 there has been a clear divergence between the two indicators. The exchange rate stands at 1.24 while monetary policy expectations put it more towards parity.
It is important to understand this point at a time when economic policy is changing in the US.
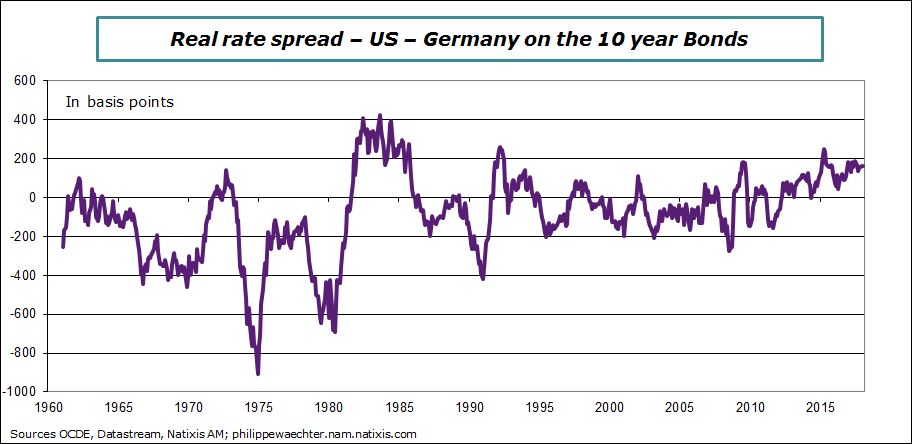
It is worth looking back to the start of the 1980’s when the greenback gained considerably as a result of much higher real interest rates in the US than in other developed countries, reflecting the impact of Paul Volcker’s very restrictive policy when he chaired the Fed at the very start of the 1980s and then the effects of Reagan’s very expansionary fiscal policy, which led to a long-lasting deterioration in the fiscal balance and the current account balance.
The rationale went like this: the Fed’s restrictive policy had pushed nominal interest rates up at a time when inflation was slowing. This provided a major short-term drive to push up the dollar. The swift and sustainable rise in the public deficit then led to a sharp jump in long-term interest rates in the US. In other words, the difference between the US and German yield curves increased significantly at this period, as shown by the chart on the long-term real interest rate spread between the two countries since 1961. At the start of the 1980s the difference was between 200 and 400 basis points, while today it only stands at almost 200 basis points but investors have still not taken on board this extent of this budgetary drift.
As I wrote in last week’s column, if we think that US monetary policy is set to adjust more swiftly than expected due to the country’s very unusual fiscal policy, then we should see a greater real interest rate spread, which would provide hefty support for the greenback.
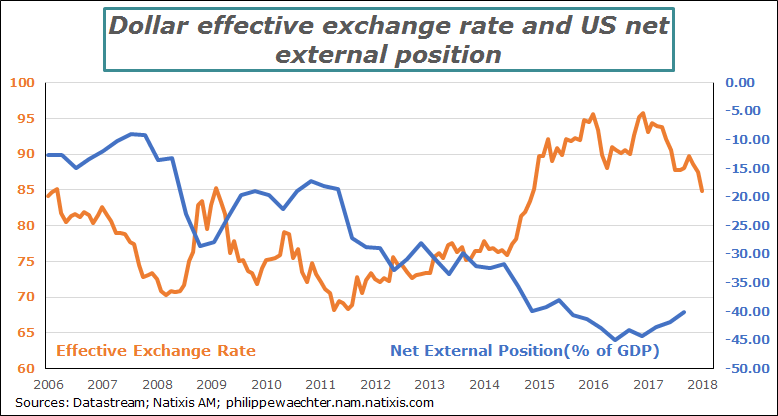
However, questions can be raised on the United States’ financial situation as reflected by its net external position. The third chart shows that this figure is negative and accounts for around 40% of US GDP, a level unseen in the past and illustrating the country’s dependency on external funding. This can be viewed in two different ways: it is either a source of weakness for the US economy that will drive away investors, or else it shows that the US economy’s financing needs are such that there are opportunities for all. The first case scenario is very negative for the dollar, while the impact of the second scenario would drive up the currency. In any case, the relationship between the net external position and the dollar does not necessarily look robust. This should be seen as a secondary factor rather than a major feature in determining the exchange rate, but in the short term, it is the factor behind the dollar’s decline.
So we are likely to see a situation that triggers a systematically higher real rate curve in the US than in the euro area in the medium term, as a result of the Fed’s monetary policy and the ongoing public deficit, thereby leading to a sustainable rise in the dollar.
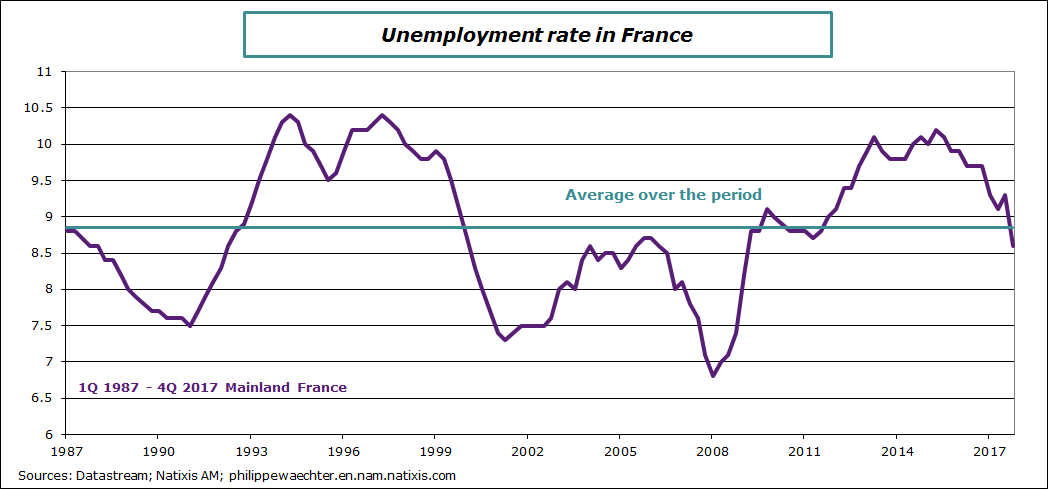
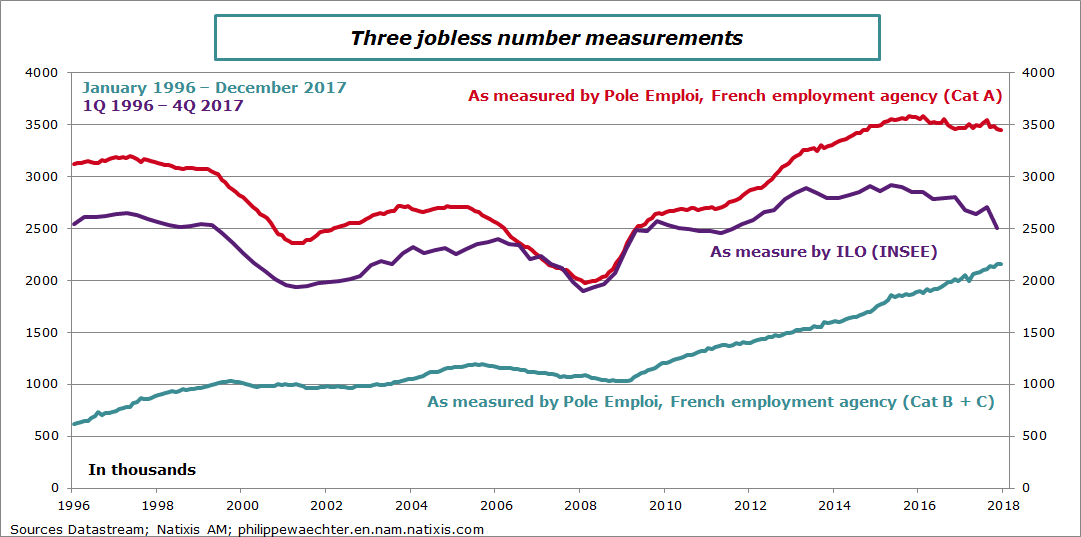
Jobless numbers dropped swiftly in France in the last quarter of 2017, falling below the 9% mark to 8.9% for France as a whole, while the figure came out at 8.6% for mainland France, which is below the average over the past 30 years (8.9%).
It is worth making a number of points on labor market figures.
The first is that the drop in jobless numbers as measured by INSEE is slightly greater than the increase in employment. Private payroll employment rose 253,000 in 2017 according to the latest estimate, while the number of unemployed fell by 298,000. This trend is set to continue in 2018 although this falling unemployment momentum could be affected by the sharp reduction in supported employment at the start of the year. We can expect lower jobless numbers in 2018, with unemployment moving towards 8% for mainland France.
The second point is that the labor market is undergoing an in-depth transformation. Employment rates are rising but this is primarily attributable to increasing employment for the over 50s. The employment rate for the 25-49 age group is currently lower than before the financial crisis, as this labor market core has not yet recovered from the effects of the crisis. Part of the explanation for the decrease in jobless numbers is the decline in labor market participation rates for the 25-49 age group at the end of 2017, although this may be a one-off occurrence that will subsequently correct.
The third point, which follows on from the second, is that measurements used to assess unemployment appear less consistent than in the past. The chart shows the trends in the various unemployment measurements either from the French Ministry of Labor (DARES statistics and research department) and INSEE. Jobless totals as measured by INSEE and the number measured by the Ministry of Labor (DARES) previously looked consistent with each other, but this no longer seems to be the case. The downtrend in unemployed figures is taking longer to emerge on the category A jobless statistics than in the INSEE measurement, but the difference is particularly visible on categories B and C. These categories previously looked like an adjustment figure, but they now form a major category, involving the jobless who have signed up with the employment agency but who work at least 78 hours (cat. B) or more than 78 hours (cat. C). This portion of the labor market is a sort of an adjustment variable that we see across most developed countries. There is now always a significant proportion of precarious employment that allows for adjustment on the labor market.
These factors show the profound change in the labor market, while at the same time the way we work is also being overhauled. The production profile is changing very quickly and the relationship between this and the labor market must adapt: this will be the key challenge for the years ahead, especially in light of the increasing role for digitalization and robotization in the economy.
Meanwhile, it is also worth keeping an eye on political events in Europe.
The Italian elections on March 4 will probably see a victory for the right and the extreme right, which includes a number of potential members of parliament who would oppose the single currency. A majority may not emerge and a coalition is likely, so this issue should be closely watched.
The other political issue to follow is the result of consultation in the SPD party on the coalition with the CDU, which is set to be announced on March 4. The coalition will probably be confirmed, as the other outcome – fresh elections – would be disastrous for the SPD after a poll published yesterday revealed that the AFD is now ahead of SPD. The situation in Germany is reaching a critical stage.
We may see a shift in Europe on March 5 after the Italian elections and the result from the SPD’s consultation in Germany.

Philippe Waechter's blog My french blog


