Central bankers are very attentive to the unemployment rate even if it is for different reasons. In the US, Janet Yellen’s main target was the unemployment rate and she drove the USA economy to full employment at the end of her mandate. Mario Draghi doesn’t focus too much on the unemployment rate during his press conferences. But when we look at low inflation pressures in a Phillips curve we can anticipate that the equilibrium unemployment rate is lower than what we previously thought. It will have to be lower than now to generate inflation pressures.
The comparison of the US and EA unemployment rates is amazing as they follow the same post recession trend
Step 1 – Profiles are similar
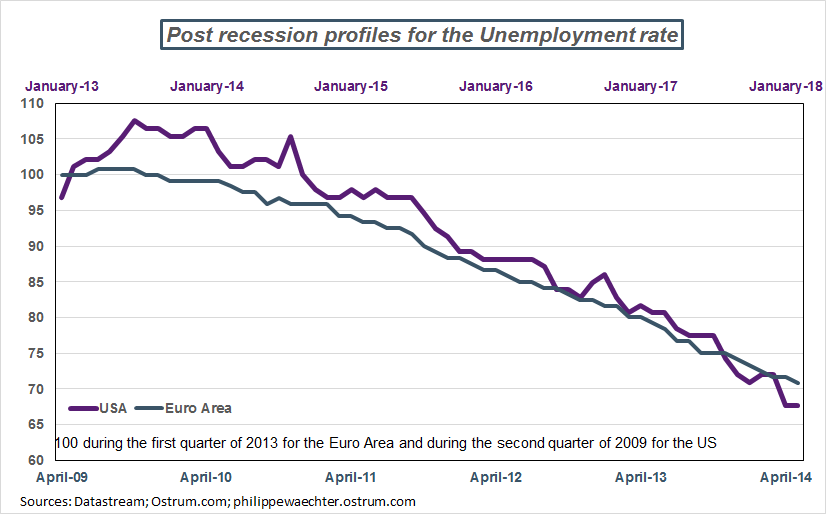
Compare the two unemployment rates from the beginning of the most recent business cycle in the US and in the Euro Area.
The NBER gives the reference dates for the US business cycle. The last trough was in the second quarter of 2009. That’s the reference period. For the Euro Area the reference period is the fist quarter of 2013. I follow the reference dates given by the CEPR.
To compare the two unemployment rates’ profile each was based at 100 during the reference period.
The two profiles are similar. The US trajectory is more volatile but 62 months after the beginning of the recovery the end point is almost the same.
Step 2 – The EA unemployment rate could be much lower
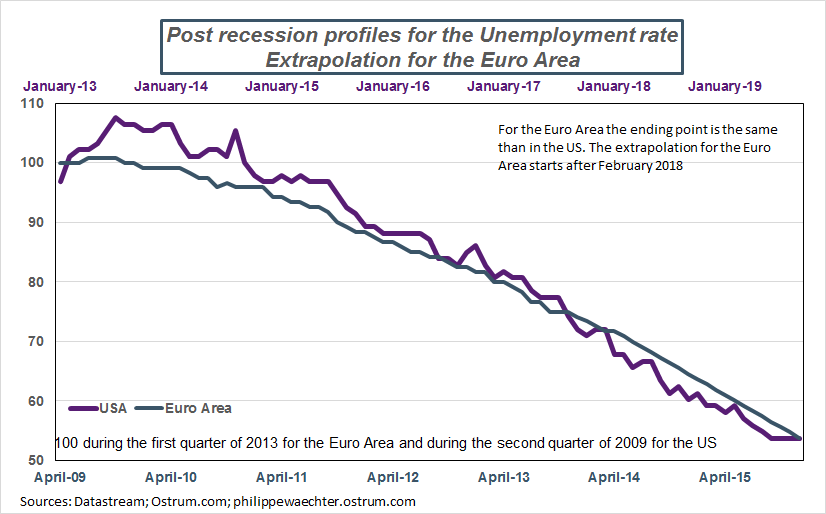
The Fed has started its monetary policy normalization during its December 2015 meeting. If we consider that the parallel between the two unemployment rates is extended we can have the date at which the ECB will start the normalization of its main interest rate.
The graph below makes the assumption that the ending point is the same in the new base (100 during the reference period)
Two remarks
The unemployment rate in the Euro Area at the end of the extrapolation period is 6.45%. It’s the lowest ever but this could be compatible with the fact that the equilibrium unemployment rate is now probably lower than in the past. Inflation pressures are then later in the business cycle. This is consistent with the current Phillips curve
The second remark is that the ending date is September 2019 just before the end of Mario Draghi’s mandate in October. It will be the task of the next president to start the EA monetary policy normalization.

Philippe Waechter's blog My french blog


