Growth figures in the Euro Area have been pretty good during the first quarter. The trend has dramatically accelerated in Spain, France is out of a long period of very low momentum and Italy is out of its recession.
Nevertheless, even with these good news, it is too early to be sure that the long stagnation that has characterized the Euro Area since the first quarter of 2011 is over. Austerity policies that were put in place at this moment have provoked a long recession in the Euro Area. The exit from this episode may start in 2015 with the new ECB monetary policy that focus on demand. 4 years to exit from the negative impact of these austerity policies that imagined that reduction in demand could imply a strong growth momentum (sic)
The current economic policy put demand at the front place to try to change the business cycle profile. I think that this is the best recipe to converge to a more virtuous business cycle.
This post wants to show the economic activity profile in the Euro Area and its main countries at the end of the first quarter. I do not give details of on composition of growth because usually only the GDP number has been published.
GDP Quarterly change
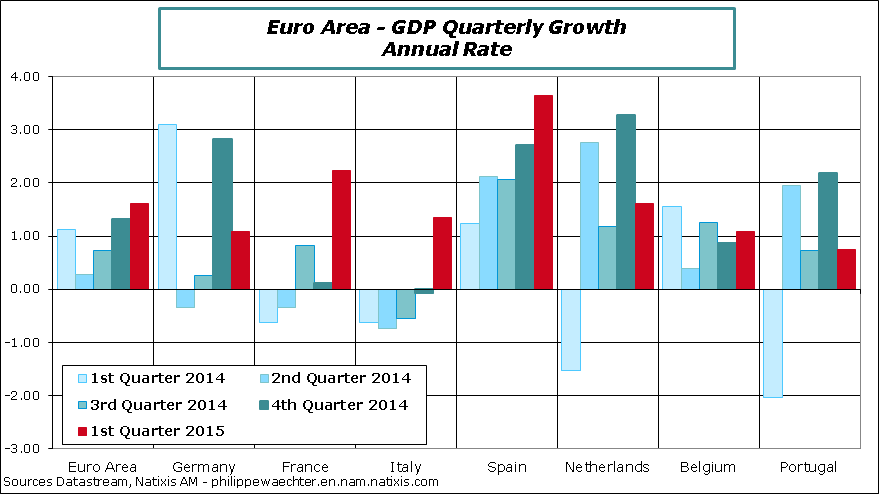
This graph shows the GDP quarterly change at annual rate. The red bar for the first quarter of 2015 shows strong performance in Spain, France and Italy. The German number is below expectations.
The table below presents the precise number of GDP quarterly growth in the first quarter of 2015 and the last of 2014.
The third line is the GDP change on a year, the fourth is the 2014 growth number and the last line is the carry over growth for 2015 at the end of the first quarter.
Remarks
On this table, Italy is lagging all the other countries. Its growth was negative in 2014 and its carry over for 2015 is still low.
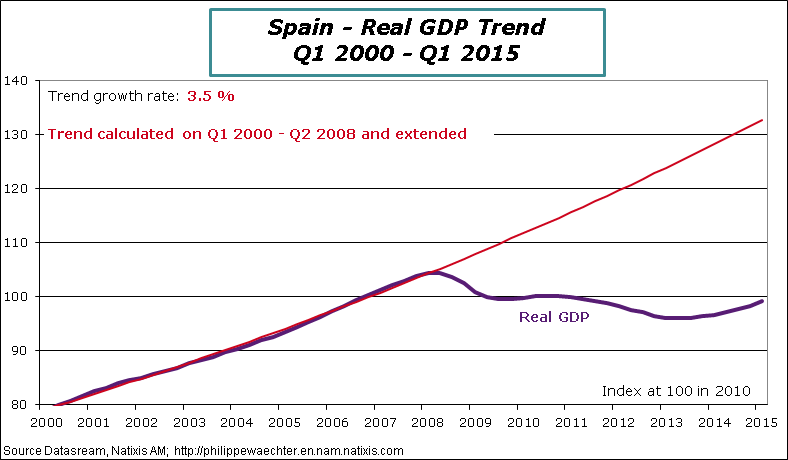
Spain is doing well with a strong carryover for 2015. It means that its growth number for 2015 could easily be between 2.5 and 3%.
In France, the 2014 growth number has been revised from +0.4% to 0.2%.
Carry over for most Euro Area countries is strong enough to converge to a growth that will be above 1% this year. The main exception will be Italy. For France, 0.2% per quarter will be sufficient to get 1%.

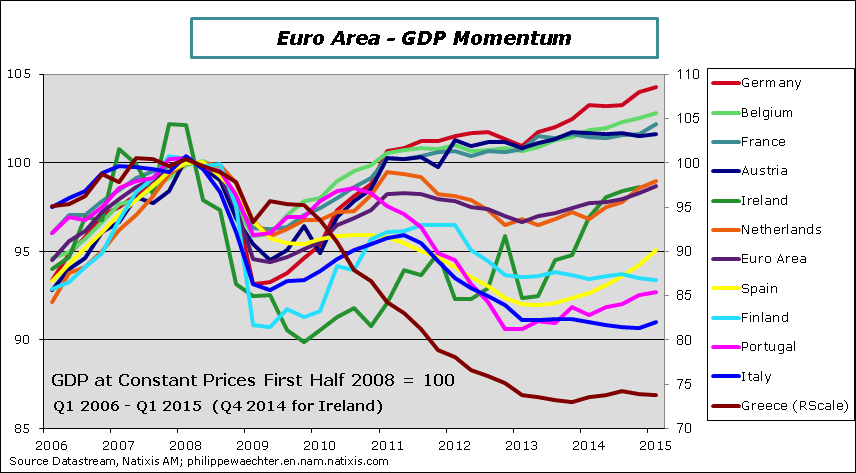
The chart below shows the level of GDP for a large number of countries. They are rebased at 100 in the first half of 2008 just before the beginning of the recession.
Remarks
The Euro Area GDP is still 1.3% below its pre-crisis level. Spain, even with a strong recovery, is 5% below and Italy is still 9% below the first half of 2008.
Finland which wanted to give lessons to Spain is starting its 4th year of recession and its GDP level is now below the Spain level on my chart. Spain was supposed to lack of rigor to manage its business. We see the difference.
GDP in Greece is now 26.2% below its pre-crisis level. We understand with this figure the large public debt to GDP ratio and the anger of the Greek population and its will to stop the mechanism.
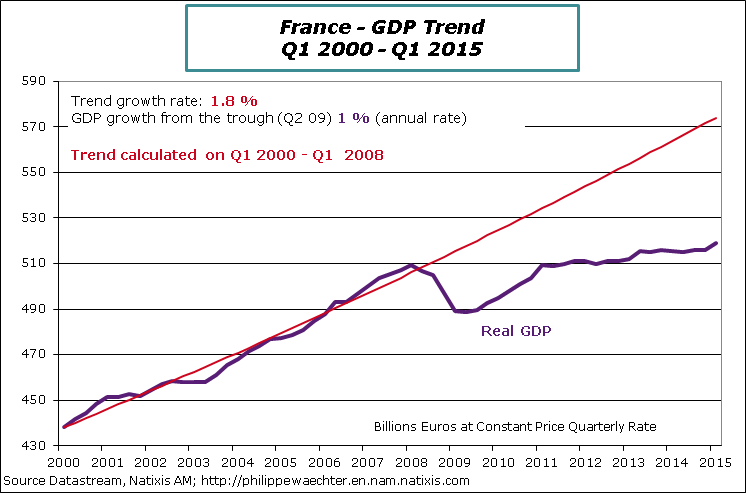
France is 2.2% above its pre-crisis level. Nevertheless we cannot conclude that France is out of its slow growth period seen since the first quarter of 2011.
In Germany the gap is positive by 4.2%. It has to be compared with the 9.2% seen in the USA and 4.1% in the United Kingdom.
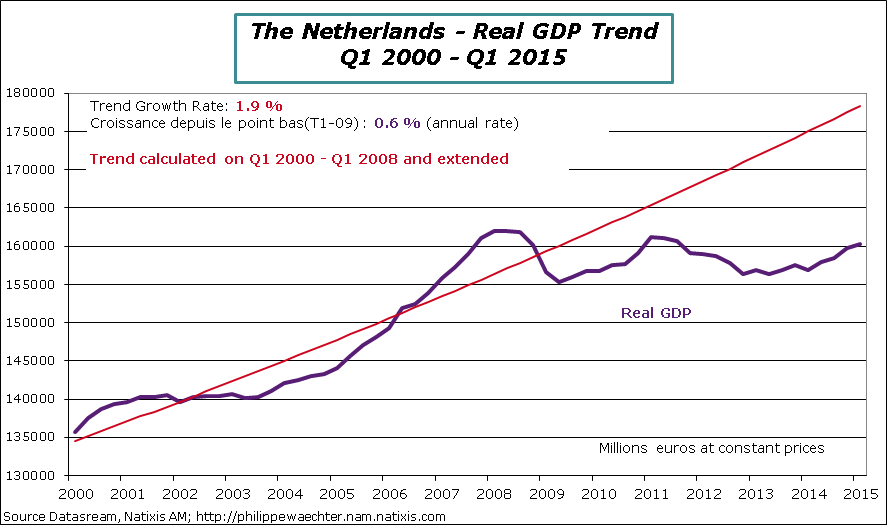
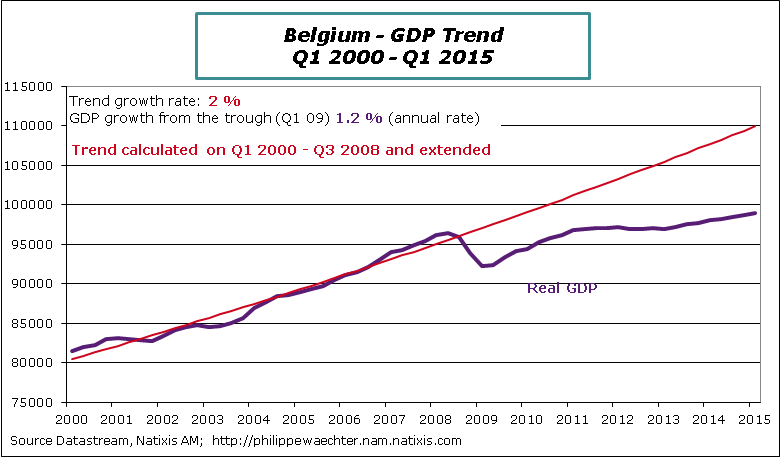
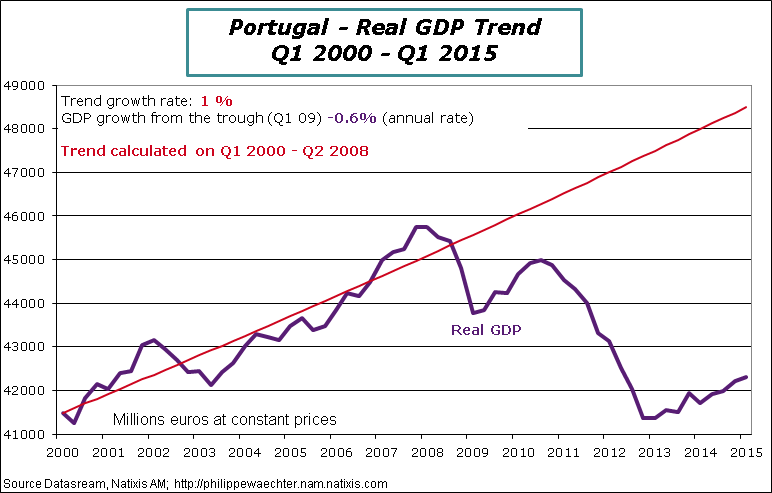
On each chart, the GDP level is accompanied by a trend that has been calculated from 2000 to the peak in the first half of 2008. The spread between the two curves measures the persistent cost of the crisis. Germany is the only country where the momentum is almost the same before and after the crisis.
Euro Area
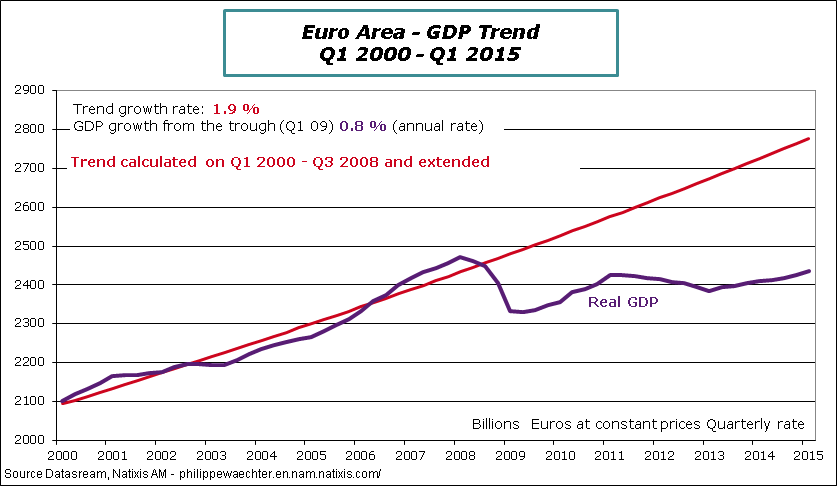
The GDP level during the first quarter of 2015 is just 0.4% above the first quarter of 2011. We see on the graph the long period of recession and the poor recovery since the beginning of 2013. We can expect a stronger momentum in the coming quarters.
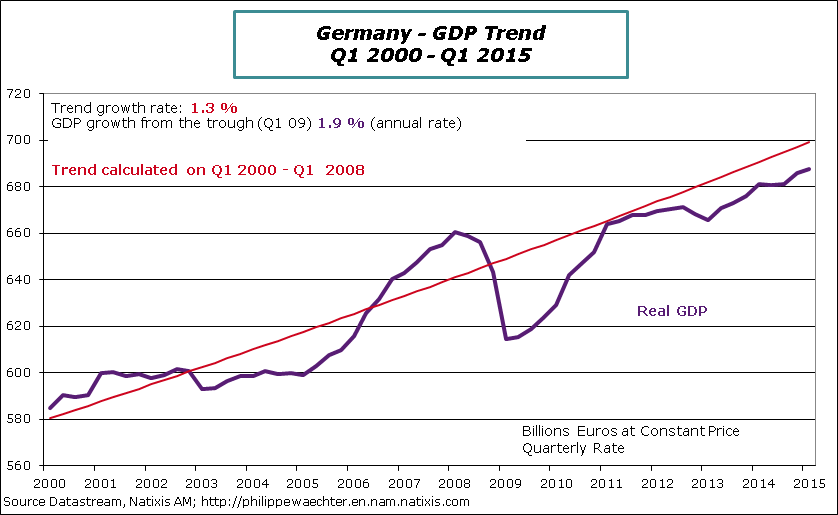
Is Germany as strong as it is usually said? The GDP level has converged to its pre-crisis trend in the first quarter of 2011 but since this period its growth is only 0.9% (annual rate)
We clearly see on this chart that more is needed to be sure that the low dynamics since 2011 is over. From the first quarter of 2011 to the first quarter of 2015 the annualized rate of growth has just been 0.5%. The 0.6% of the first quarter will have to be confirmed.
Since 2011 the Italian economy was in recession with a milder trend since 2013. The improvement during the first three months of 2015 is consistent with a strong rebound in confidence indices since last fall. The upward trend will continue.
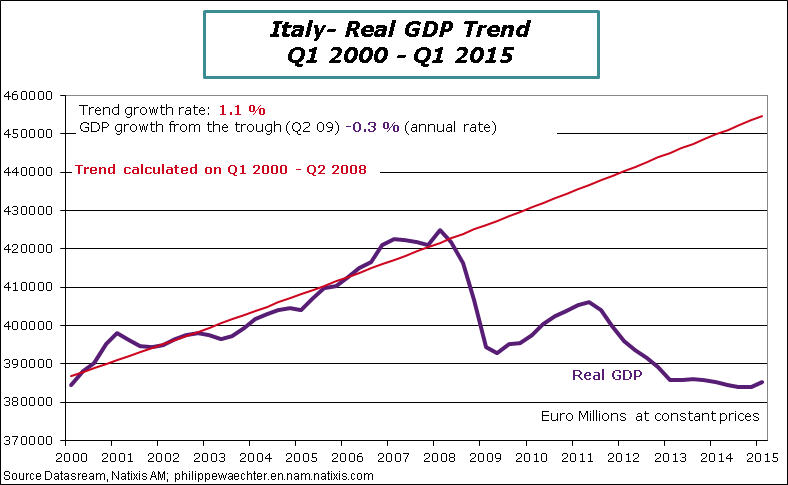
The recovery is clearly seen on the graph but there is still a long way to go to converge to the pre-crisis level.


