The downturn in the US industrial sector is confirmed month after month. September’s figures do not invalidate the trend observed since the beginning of the year.
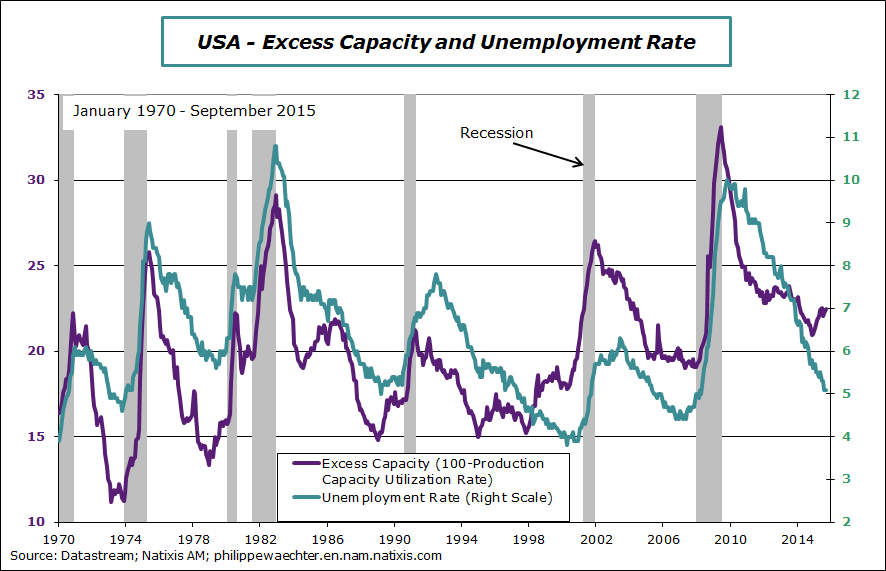
The tension indicator, production capacity utilization rate, follows a downward trend since January. Here for an easier reading and for a rapid comparison with the unemployment rate I put excess capacity (100 – Utilization Rate).
Since the early 90s the reversal of this indicator is a little ahead of the labor market. There may be still for a few months a divergent dynamics between the 2.
Nonetheless past developments suggest that lower tensions on the production side pull, at the end of the day, the unemployment rate with it. The slowdown would then be recorded and the Fed would be even more reluctant to get tough on monetary policy.


