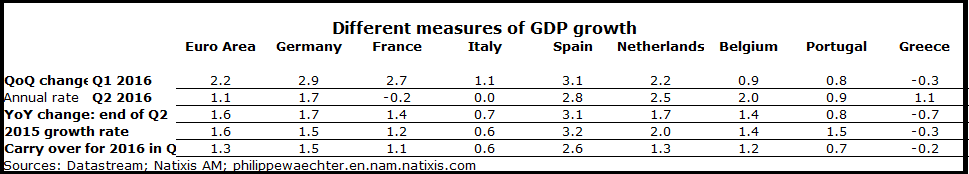
GDP growth for the Euro Area was confirmed at 0.3% (flat) for the second quarter of this year (2.2% at annual rate).
The table below shows growth figures for different countries of the Euro Area.
In the largest Eurozone countries there is a slowdown during the second quarter. This is the case for Germany (from 2.9% to 1.7%), for France (+2.7% to -0.2%) for Spain (from 3.1% to 2.8%) and for Italy (from 1.1% to 0%) Growth is stronger in other countries.
Carry over for 2016 at the end of the second quarter is 1.3% for the Euro Area but 1.5% for Germany and 2.6% for Spain; but just 1.1% for France and 0.6%% in Italy. For other countries it is circa 1% except for Greece where it is still negative.
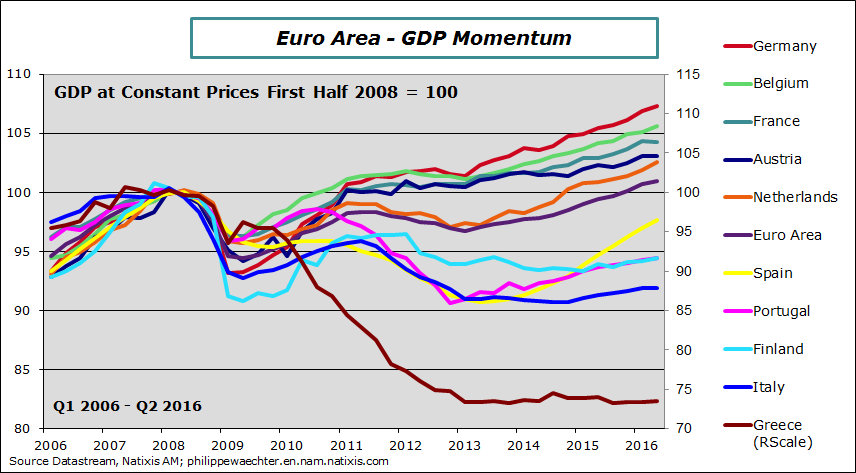
The following graph shows GDP level from the beginning of 2006 to the second quarter of 2016 (rebased at 100 during the first half of 2008 (just before the Lehman moment)).
Five countries of the sample have a GDP level that is still below 2008 level. This is the case for Greece where GDP level is almost stable since 2013 but more than 26% below 2008.. This is the case for Italy where there is no clear recovery. The GDP level is now 8.1% below its 2008 level. Its GDP level is close to its 2013 level but way below 2008 .
The Portuguese recovery continue but without acceleration (-5.5% below 2008). It has started like Spain but has not accelerated since the end of 2014. Finland is still weak (-5.5% below 2008). Spain recovers but its GDP level is still 3 percentage points below 2008. This is not a total success story yet on the period.
The Euro Area is just 1% above its 2008 level showing a very slow recovery.
The best performer on the graph is Germany with a GDP 7.3% above 2008. To have a base of comparison, the UK is at 8% and the US at 11%.
The main reason for the deceleration of growth in the Euro Area is a weaker internal demand momentum. We saw that for France in details and for the Eurozone when looking at consumption expenditures(see here). The German statistical institute has added this morning that corporate investment contribution was negative during the second quarter and that the main source of growth in Germany was net exports. Consumption has had a positive contribution but in this first publication there are no figures except GDP
We can expect a rebound in the third quarter on consumers’ expenditures. The second quarter has been abnormally weak and we can expect a positive contribution. The main question is related to corporate investment. It was negative in France and in Germany in Q2. Without a strong rebound, growth for 2016 and after is at risks.
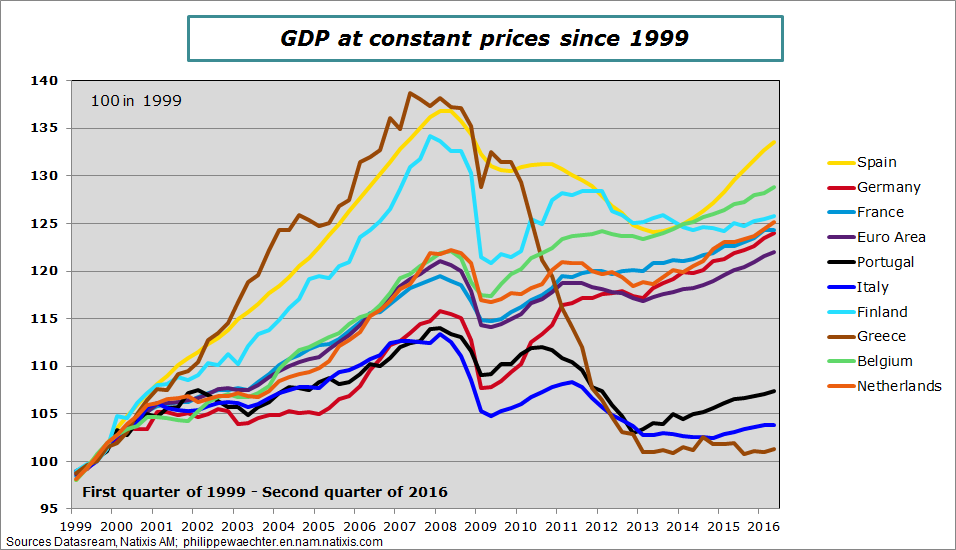
In order to have a longer comparison, I have rebased these figures at the beginning of the Euro Area in 1999. The story is very different.
Spain and Belgium are at the top of the graph, four countries follow with comparable performance (Finland, France, Germany and Netherlands). Three countries have a very different story. In these three countries there is a specific story for Greece with an up and down trajectory (we know what has happened in Greece). For Portugal and Italy the story is close. While growth was up everywhere in the Eurozone, this wasn’t the case for these two countries for different reasons. Since the crisis and austerity policies they is a real divergence with the rest of the Eurozone. Their GDP level is now close to 2000 level.
The question for these three countries is their capacity to converge to the Euro Area average. What types of adjustments will be necessary to converge?
An interesting point is that before the crisis, the German story was not very different from Italy and Portugal. The difference was that the German growth was not depending too much on its internal demand. It was pulled up by the renewed Asian momentum after 2009. This wasn’t the case for Italy and Portugal