Ostrum
  • News & Chronicles
  • France
  • Euro Area
  • United States
  • International
  • Politics & Society
  • Monetary Policy
  • Media
  • Decoding
  • About Philippe Waechter
Philippe Waechter's blog
  • Insights
  • About us
  • Expertise
  • Our people
  • Media

Philippe Waechter's blog
My french blog
  • News & Chronicles
  • France
  • Euro Area
  • United States
  • International
  • Politics & Society
  • Monetary Policy
  • Media
  • Decoding
  • About Philippe Waechter
  • News & Chronicles
  • Climate
  • France
  • Euro Area
  • United States
  • International
  • Politics & Society
  • Monetary Policy
  • Media
  • Decoding
Philippe Waechter's blog
Prévôté
Previous Next
  • 2 min

Higher inflation rate in the Euro Area – It's oil price

  • 31 January 2017
  • Philippe Waechter
  • inflation rate
  • Oil Price
Total
0
Shares
0
0
0

The Euro Area inflation rate jumped at 1.8% in January after 1.1% in December 2016.
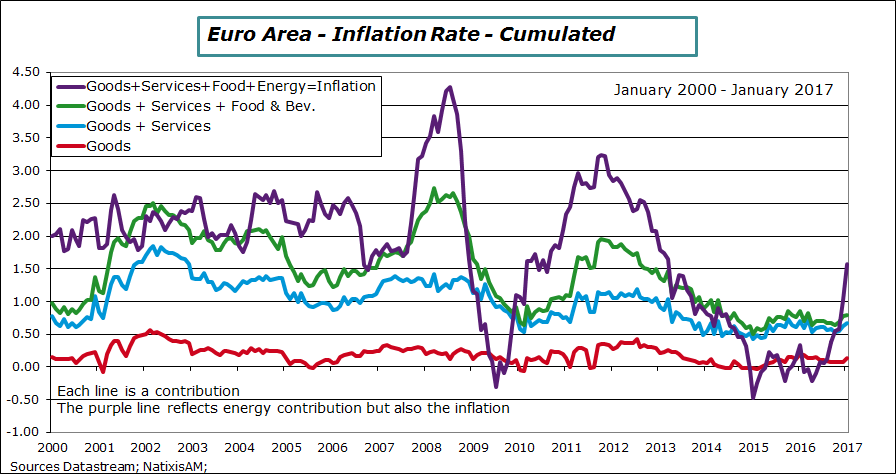
The graph below shows the cumulated contributions to the inflation rate. It can be read in the following manner: the red line is the goods price contribution to the inflation rate; the blue line is the sum of the red line plus the services price contribution to the inflation rate; the green line is the sum of the blue line and of the food price contribution to the inflation rate. Alle these prices represent more than 90% of the Consumer Price Index. The green line is almost stable; its range is 0.6% – 0.85% since mid-2014. There is no surge in inflation through all these prices.
The last line, the purple one, is the sum of the green line and of the energy price contribution to the inflation rate. The purple line is by construction the inflation rate. The picture is now very different. The inflation rate is volatile and was sometime negative in 2015 and 2016. It is now at 1.8% and this represents the impact of the oil price.
ea-2017-january-inflation-contrib.png
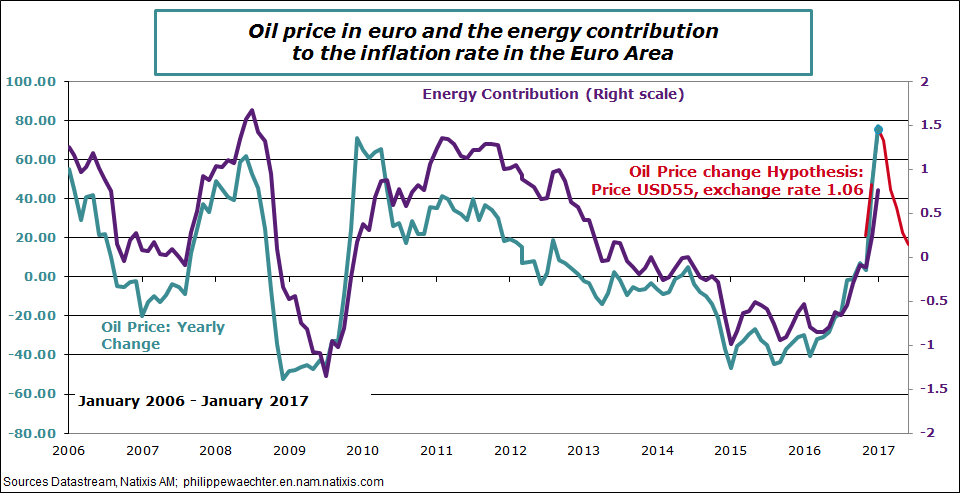
With the hypothesis that the oil price remains at USD 55 in the coming months, then the peak of the oil price change was seen in January. That’s what the second graph shows. The blue line is the oil price annual change in euro. The red line is the change until June 2017 if the price remains at USD 55 with a euro exchange rate at 1.06.
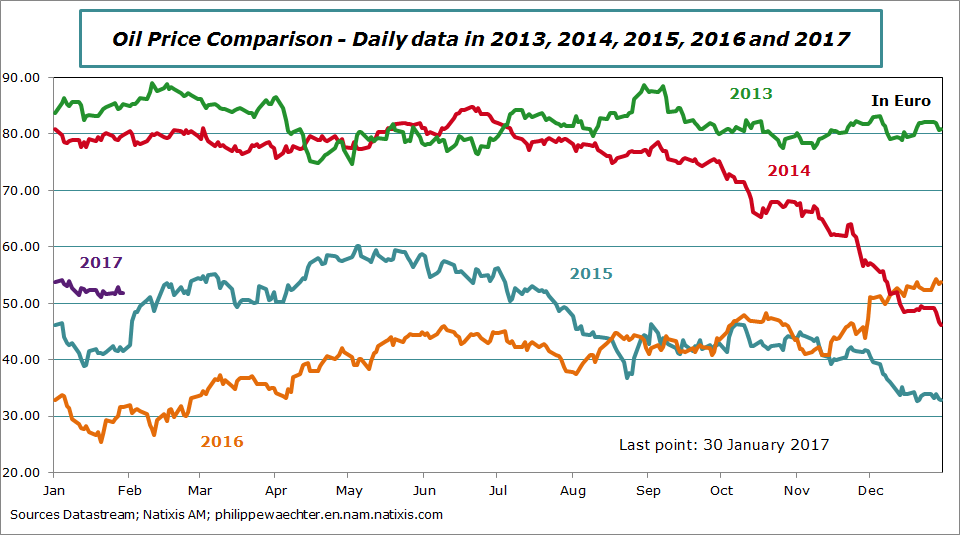
On the third graph we can see the oil price profile year after year. We see that 2017 is very high compared to the same period in 2016. That’s the reason of this positive contribution from the oil price. With a oil price at USD 55 and a euro at 1.06, then the price in euro is at 51.8. In January it was at €52.4. Therefore, we see on the graph that the convergence to 51.8€ will lead to a smaller oil price contribution.
There is lag in the CPI and probably the energy contribution is not at its peak yet. Therefore, the inflation rate could go higher in February. After it will slowdown converging to the core inflation rate at 0.9%
We see here the reason of stability of the monetary policy stance from the ECB. The spike in the inflation is transitory.
In most countries the inflation rate acceleration has the same roots than in the Eurozone. It’s only a matter of oil price. I believe that the oil price will remain in a corridor around USD 55, then inflation rates in every country will slowdown. Then it will cool pressures on long term interest rates.
ea-2016-january-oilprice-inflation.png
The last graph compares the oil price year after year. The discrepancy between 2016 ans 2015 was high at the end of 2016. This is still the case for 2017 compared to 2016 in January. This will vanish progressively.
oilprice-2013-2017-30january.png

Related Topics
  • inflation rate
  • Oil Price
Subscribe to the newsletter

All the news from Philippe Waechter’s blog in your mailbox


Loading

Le magazine d’experts d’Ostrum

ABOUT OSTRUM AM
  • About us
  • Media room
  • Our publications
  • Cookie Policy (EU)
FOLLOW ME ON
EXTERNAL LINKS
  • Economists
  • Think tank
  • Central banks
  • Blog roll
©Ostrum AM 2025
An affiliate of : Plan de travail 2

Input your search keywords and press Enter.

Manage Cookie Consent
We use cookies to optimize our website and our service.
Functional Always active
The technical storage or access is strictly necessary for the legitimate purpose of enabling the use of a specific service explicitly requested by the subscriber or user, or for the sole purpose of carrying out the transmission of a communication over an electronic communications network.
Preferences
The technical storage or access is necessary for the legitimate purpose of storing preferences that are not requested by the subscriber or user.
Statistics
The technical storage or access that is used exclusively for statistical purposes. The technical storage or access that is used exclusively for anonymous statistical purposes. Without a subpoena, voluntary compliance on the part of your Internet Service Provider, or additional records from a third party, information stored or retrieved for this purpose alone cannot usually be used to identify you.
Marketing
The technical storage or access is required to create user profiles to send advertising, or to track the user on a website or across several websites for similar marketing purposes.
Manage options Manage services Manage {vendor_count} vendors Read more about these purposes
View preferences
{title} {title} {title}