The GDP growth was 1.7% (at annual rate) during the fourth quarter of 2016.It was a mere 0.4% in the third quarter. For 2016 GDP was up 1.8% after 1.5% in 2015.
The carry over growth for 2017 at the end of 2016 is 0.5%. It was the same number at the end of 2015 for 2016.
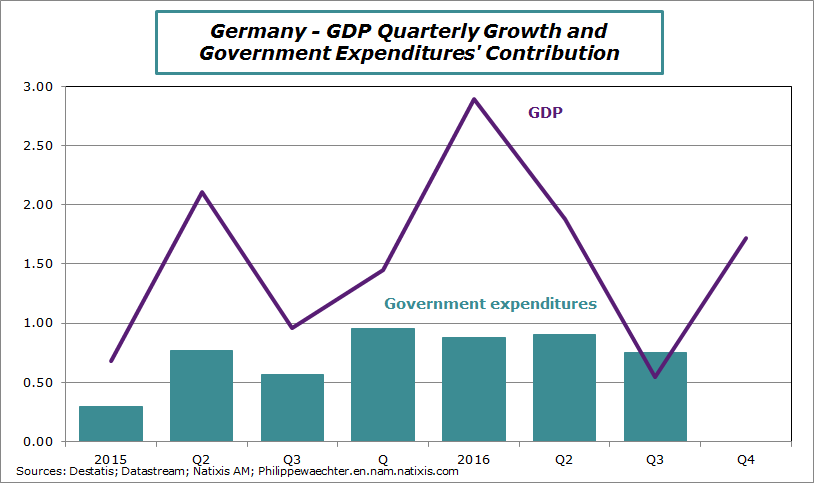
Domestic demand is currently the main support for growth with a high contribution from government expenditures. Since the first quarter of 2015, GDP growth is +1.5% on average and the government expenditures’ contribution is +0.7%; Almost half of it, that’s a large number (data until Q3 2016, the detail for Q4 is not available yet).
Construction is also an important contributor.
Government expenditures and construction are the German response to the refugees’ crisis, leading to a more autonomous .growth. Net exports have a negative contribution (imports were up due to a robust domestic demand).
Growth in Germany follows now a more autonomous and centered growth framework. It has a positive and persistent impact of the Euro Area growth.
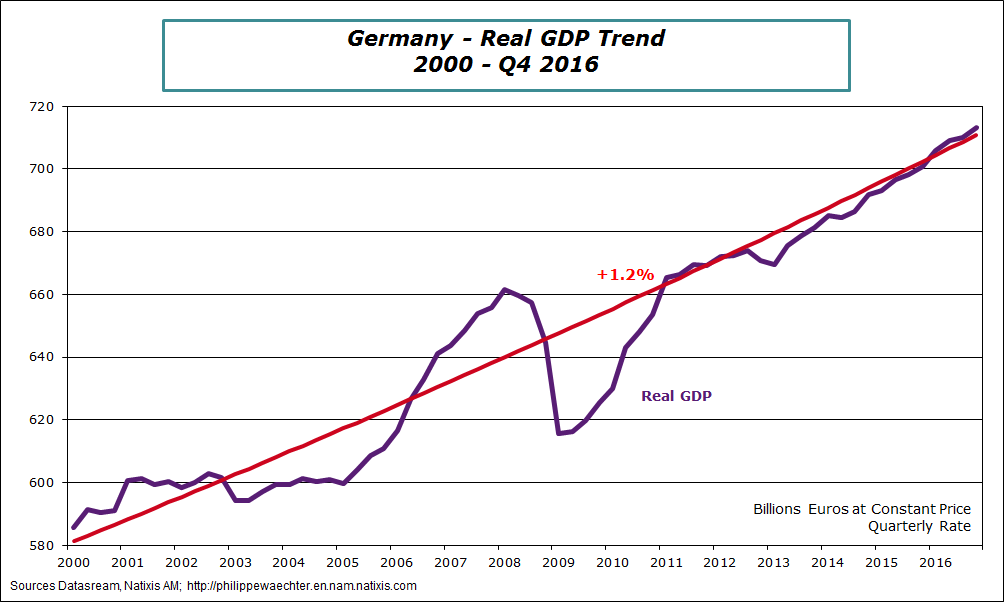
The first graph shows the stability of the German business cycle. There is no break in the crisis contrary to what was seen in every other developed country. This reflects the absence of rupture in the private domestic demand. (The break in 2008 is mainly associated with external trade in Germany)
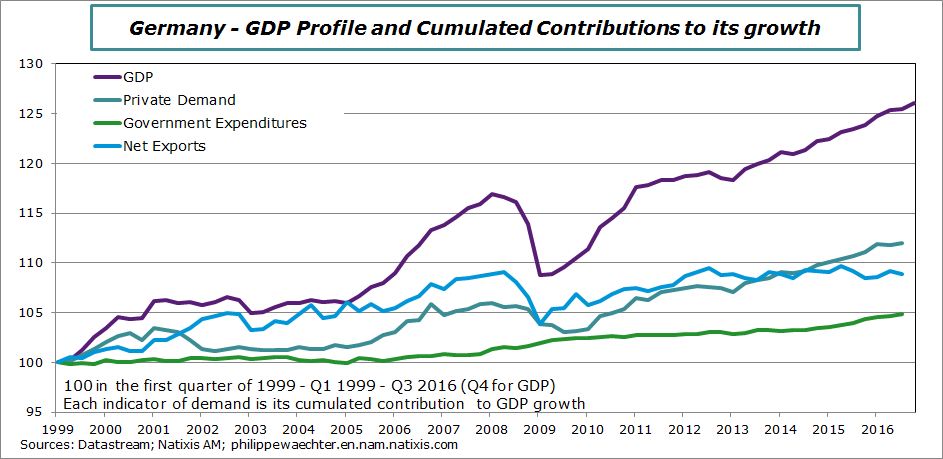
The second graph shows the cumulated contributions of different sources of demand to GDP growth. On the right part of the graph we see that the main sources of growth are the private demand and government expenditures. Since 2013, the net exports contribution is almost neutral (no upward trend).
This support from domestic demand is a source of improvement for the Eurozone
The third graph is the government expenditures’ quarterly contribution to GDP growth since 2015. On average GDP growth was 1.5% and the contribution was 0.7%.

Philippe Waechter's blog My french blog


