Are the United States facing the biggest break in activity in their history?
This may be the story told by the number of weekly jobless claims.
It is linked to the number of contamination cases. And this number is currently increasing at an exponential rate
The deterioration of the labor market is not over.
On March 20, the number of jobless claims was published at 3,238,000. The previous week, March 13, that number was only 282,000.
Never in the history of this statistic, appearing since January 1967, such a break had been observed. The highest precedent was October 1, 1982 with a registered number of 695,000.
This weekly indicator is a good signal about the pace of the American business cycle and the figure for March 20 suggests a depression more than a recession. The March employment report could indicate more than 800,000 job losses. These data would also be compatible with a year-over-year decline in US GDP in a range between -4% and -5%.


The main reason for this sudden increase in registrations is to be found in the impact of the coronavirus. The highest cumulated increase is associated with the states with the most contamination.
The graph shows on the horizontal axis the number, by state, of people contaminated by the Covid-19 . The bar is the accumulation of jobless claims by state with the characteristic of the number of infected. For example, the sum of registrants in states with between 1001 and 5000 infected is 1,287,528.

Over the week from March 13 to 20, the number of confirmed infected increased from 2,179 to 19,100. This is a lot but little compared to the evolution observed since this date. On March 26, the number of confirmed American infected rose above the Chinese figure, and stood at 83,836. In barely a week, the number of American infected was multiplied by 4. The graph of the progression in the USA is eloquent.
This implies that the number of weekly jobless claims will further increase very rapidly in the week of March 21-27.

A direct consequence is the drop in the number of jobs in the labor market report to be released on April 3. Generally, when the number of weekly jobless claims is around 400,000, there is no net job creation.

The publication of the figures for the week from March 13 to 20 changes the scale of the graph. We see on the right of the graph, the impact of the inscriptions published on March 20.
Suddenly, the contraction in employment could be on the scale of what had been observed after several months of crisis in 2008.
We can anticipate some 800,000 job cuts, maybe more ….
Such a decline in employment will translate into a rapid contraction in activity. GDP could contract over a year from 4 to 6% in the second quarter.
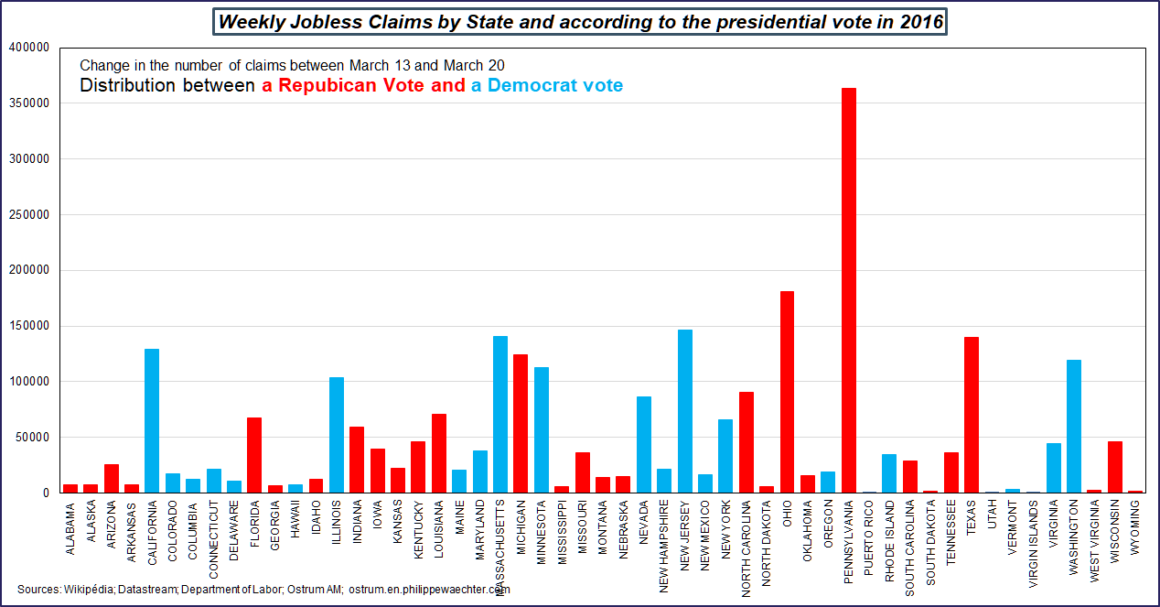
The final aspect of this report is the political impact it will have. We note that it is in the states that voted Trump in 2016 that the adjustments are, on average, the most important. In the states that voted Republican, weekly registrations increased by 1,478,000 while in the states that voted Democrats the increase is 1,169,000. The industrial states are very affected, it is those who voted for Trump in 2016. If the crisis deepens due to the spread of Covid-19, the situation could worsen in these states and penalize the Republican vote on November 3.


