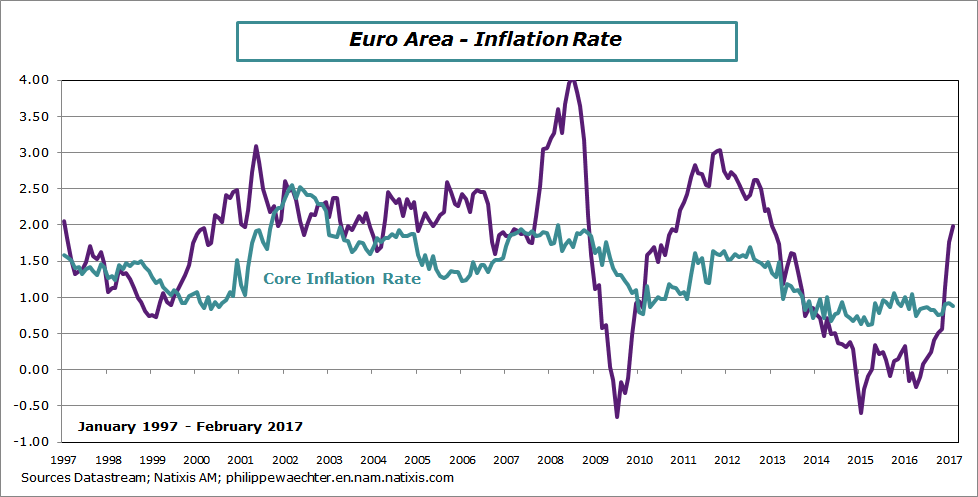
The inflation rate was at 2% in February after 1.8% in January. It’s the highest record since January 2013. The core inflation is stable at 0.9%. It means that energy is the main driver for the higher inflation rate.
The first graph shows that the core inflation rate is stable since 2014 and the volatility of the inflation rate is associated with the oil price yearly change.
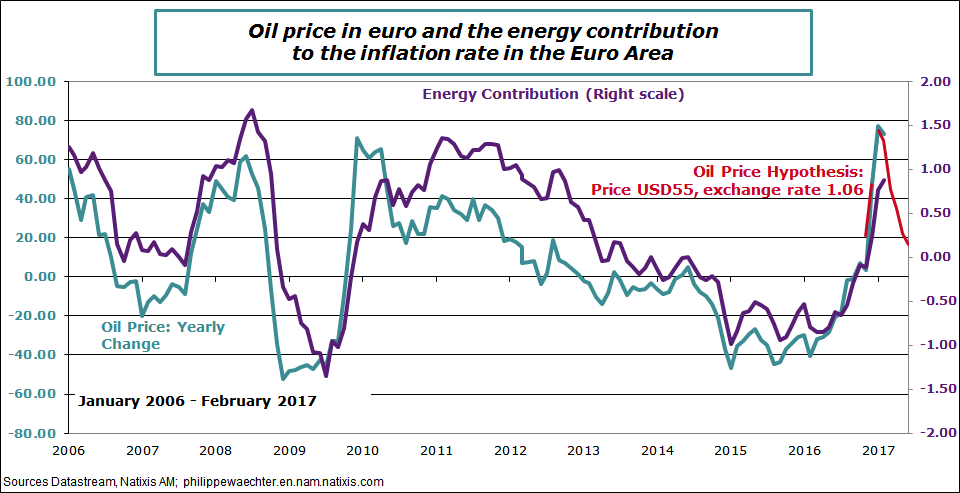
The oil price effect has started to diminish. The second graph shows the consistency between the yearly change in oil price (blue) and the energy contribution to the inflation rate (purple). We see that the oil price change has peaked in January and will follow the red line which shows the oil price yearly change when the oil price is at 55USD and the exchange rate at 1.06.(the last point is June 2017)
The oil price impact will be transitory and the energy contribution will start decreasing in April probably as there is persistence and delay between the oil price and contribution.
In other words, after the current peak, the inflation rate will converge to the core inflation rate (circa 1%).
This temporary effect of oil price on inflation is a strong incentive for the ECB to keep its monetary policy stance unchanged.

Philippe Waechter's blog My french blog


