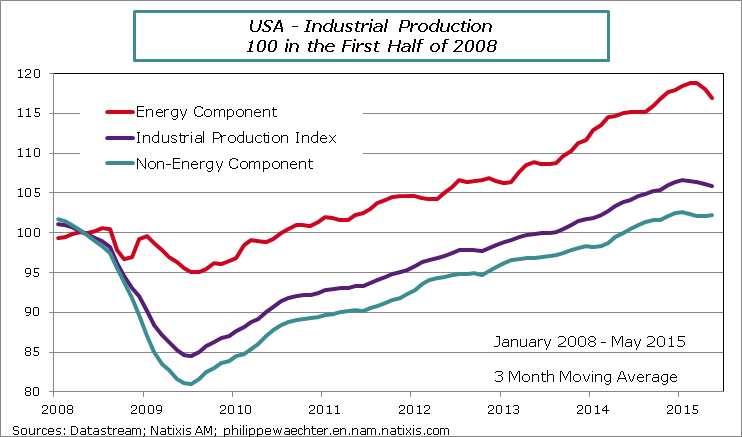
Since the high point seen in January, the industrial production is trending downward.
The energy component of the index is falling rapidly but this is consistent with the stories told around oil price decline. This latter has reduced incentives to develop the sector. The non-energy component of the index is also decreasing but at a slower pace. On this part of the index, the high value of the dollar has probably had a negative effect on the activity. As the low momentum spreads in spring, this rules out an explanation linked to a climate hazard for the winter soft spot
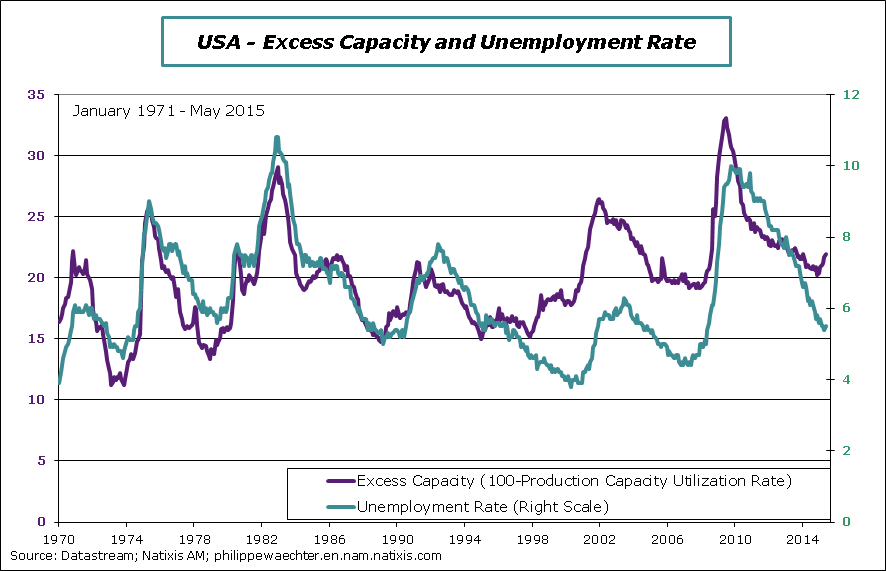
The interesting graph is the one that shows the parallel evolution between the available production capacity and unemployment.
Until the late 80s, the available capacity or excess capacity (100 – production capacity utilization rate) and the unemployment rate changed direction at the same time. Peaks and troughs of the business cycle were well synchronized between the two indicators. Each represents a tension on the US economy; it is not illogical that both indicators have simultaneous inflections
However, since the early 90s, the available capacities reach a peak or a trough several months ahead of the unemployment rate. There is a kind of determinism between the two and it goes from capacity to the unemployment rate.
Since January, available capacities are growing rapidly, while the unemployment rate remains on a downward trend. Looking at the historical record, one cannot exclude that the peak of the US economic cycle has been already touched. This would force us to think differently at monetary policy


