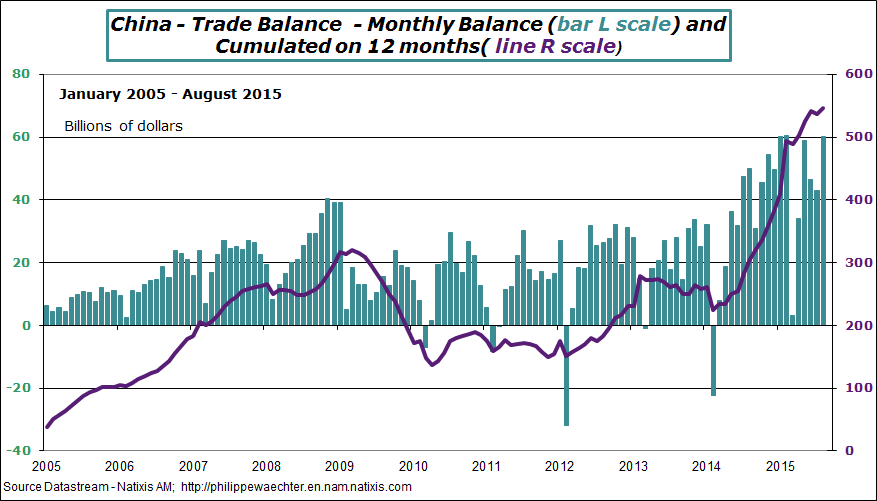
The Chinese external trade surplus is almost at its highest in August 2015. It is close to USD 60bn. Cumulated on twelve months, the surplus is at its highest ever. That’s what we see on the graph.

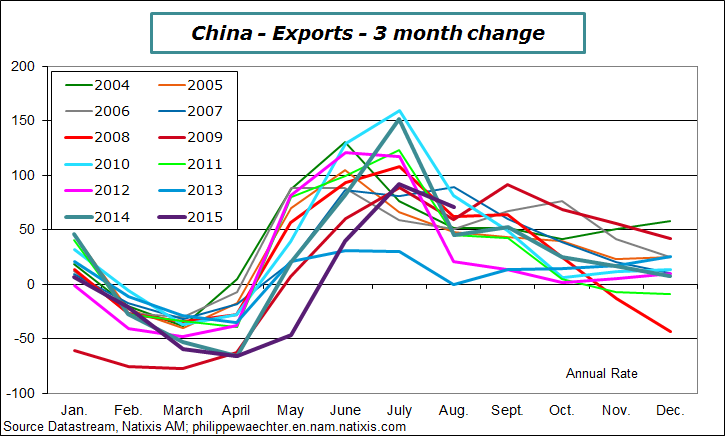
The second graph shows the 3 month change in exports (at annual rate). It compares every year since 2004.
2015 has the lowest profile when compared to previous years. This is related to the low momentum seen in world trade and probably a lower of competitiveness for the Chinese manufacturing sector.

This has two consequences
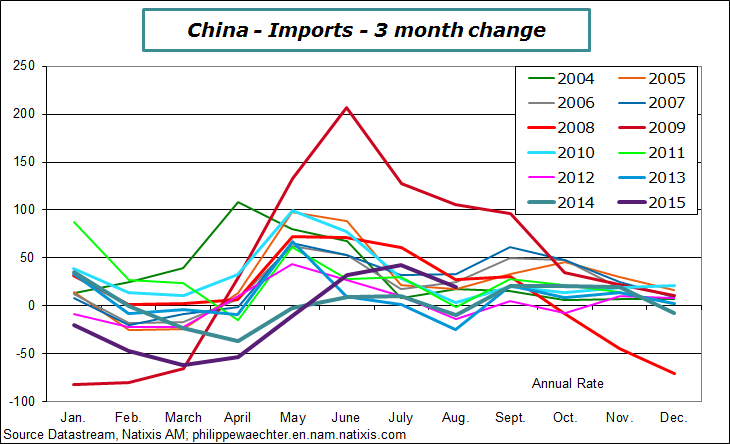
China has a lower impact on emerging countries’ exports. Since Chinese membership to the World Trade Organization, it has played an important role in emerging countries growth. It’s no longer the case as Chinese imports follow a low trajectory.
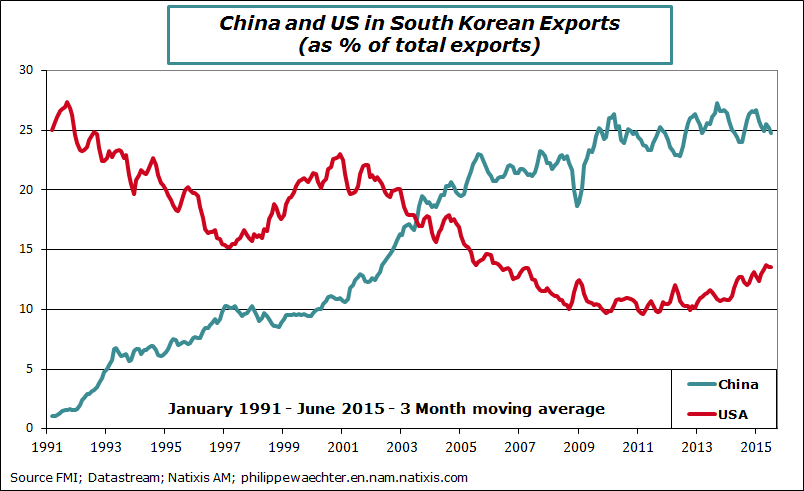
There is also less imports as China exports less. Many Asian countries used to export directly to the USA. China has changed that and most of these countries now export first to China which transforms the product and then exports it to the USA. As world trade momentum is lower, there is less exports for China and then less imports in China. This has a negative impact for Asian countries which are now more dependent to China than they were in the past. (see the example of South Korea in annex)


Philippe Waechter's blog My french blog


