Ostrum
  • News & Chronicles
  • France
  • Euro Area
  • United States
  • International
  • Politics & Society
  • Monetary Policy
  • Media
  • Decoding
  • About Philippe Waechter
Philippe Waechter's blog
  • Insights
  • About us
  • Expertise
  • Our people
  • Media

Philippe Waechter's blog
My french blog
  • News & Chronicles
  • France
  • Euro Area
  • United States
  • International
  • Politics & Society
  • Monetary Policy
  • Media
  • Decoding
  • About Philippe Waechter
  • News & Chronicles
  • Climate
  • France
  • Euro Area
  • United States
  • International
  • Politics & Society
  • Monetary Policy
  • Media
  • Decoding
Philippe Waechter's blog
Prévôté
Previous Next
  • 2 min

4 graphs to understand the US inflation rate

  • 16 September 2016
  • Philippe Waechter
  • CPI
  • inflation rate
Total
0
Shares
0
0
0

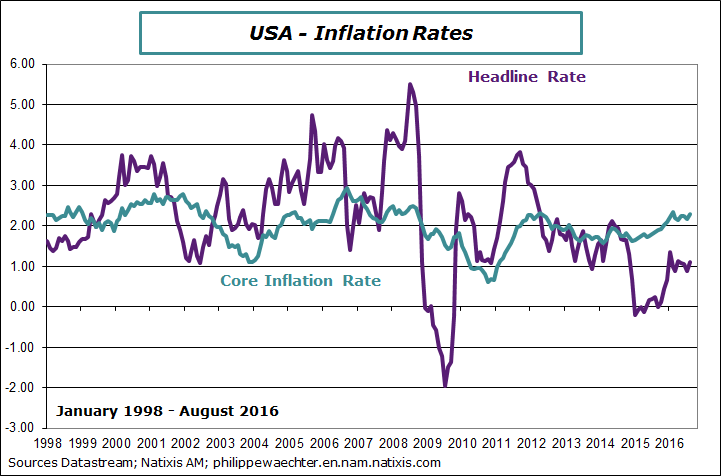
The inflation rate was  1.1% in August, close to the average seen since the beginning of the year (1.1%). The core inflation rate was at 2.3% the highest number since last February.
usa-2016-august-inflationCPI.png
The surge in the core inflation rate can be decomposed between Housing and the rest of the index.
The following graph shows the Housing contribution to the inflation rate and the core rate contribution to the inflation rate. The Housing contribution explains more than 60% of the core contribution to the inflation rate. This the weight of the housing sector that makes a difference with the PCE index followed by the US central bank. It corresponds to a very different methodology.  This means that all the other components of the core price index explain only 40%.usa-2016-august-housing.png
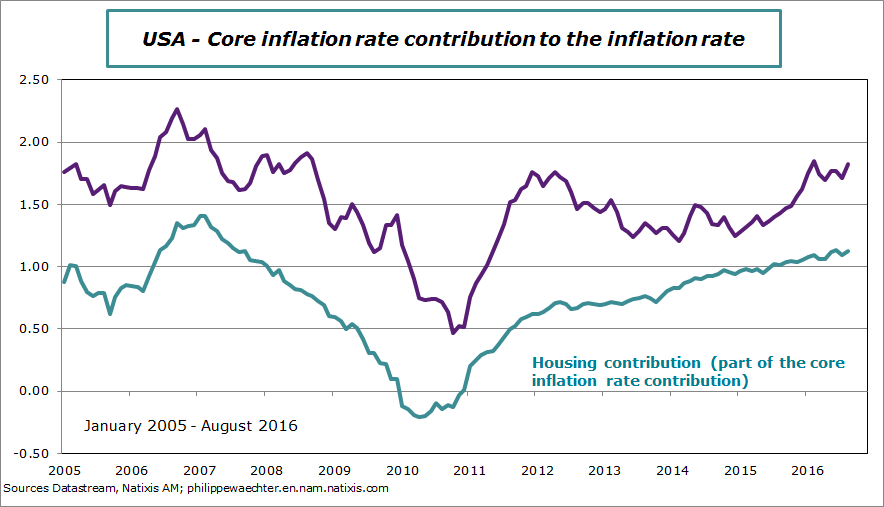
In the 40% it is interesting to see each sub index contribution. We see a strong contribution from the Health price index. All the other contributions are low and some are declining.
usa-2016-august-subindices.png
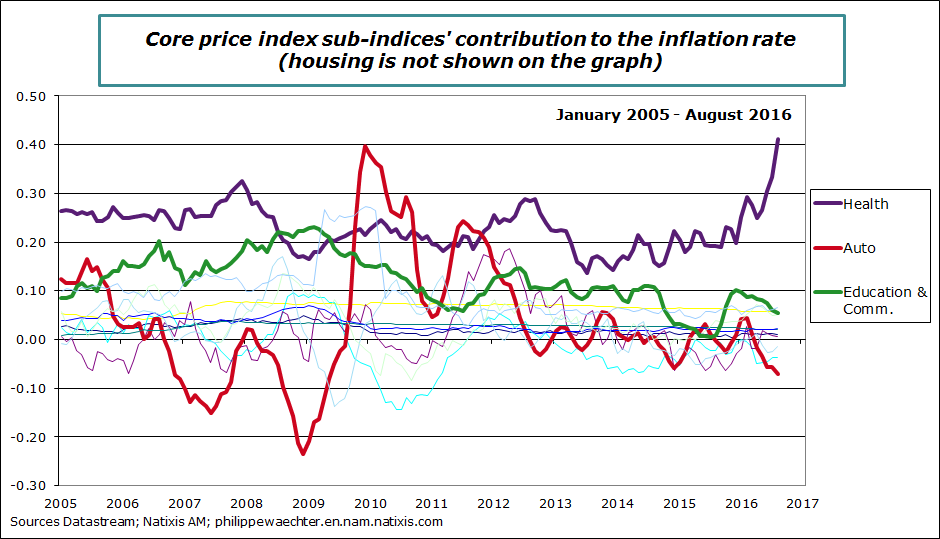
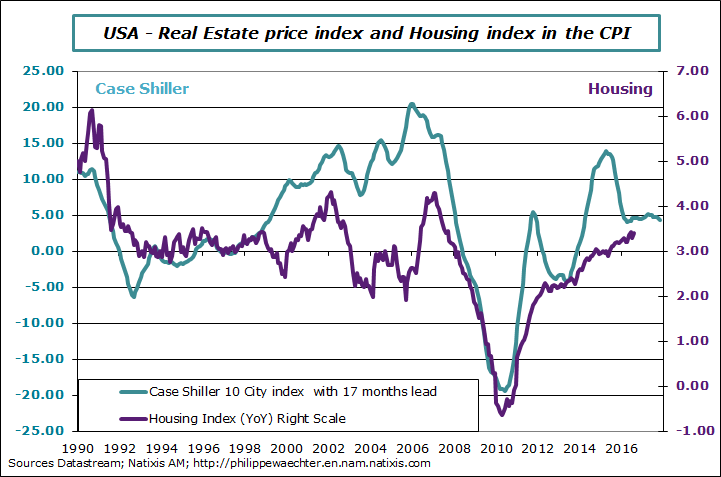
OK the core inflation rate is up to 2.3% but only through strong contributions from the Housing sector and from the Health sector. The first reflects the higher real estate price and a catch up effect. The real estate adjustment seen on the graph below is beyond the CPI issue. The Health index price is up but this is not a market price.
As all the other sub indices in the core price index are not accelerating we can say that the core inflation rate has a bias on the upside linked to Housing and Health but this doesn’t reflect tensions inside the US economy. That’s why the Fed must be careful in the way it takes this index (which is not its favourite) into account.
usa-2016-august-cpihousing-xaseshiller.png

Related Topics
  • CPI
  • inflation rate
On the same topic
  • 2 min

Lower inflation rate and slower growth

  • 1 February 2019
  • Actus & Chroniques

Philippe Waechter

The inflation for the Euro Area was at 1.4% in January after 1.6% in December.The main reason for this drop is the negative impact of the oil price. The energy…
  • Asia
  • Euro Area
  • Italy
READ
  • 4 min

The manufacturing sector is running out of steam in the euro area – My Monday column

  • 25 April 2018
  • Euro Area

Philippe Waechter

World growth stepped up a pace in 2017 as a result of a policy mix that was heavily on the side of demand, while effective monetary accommodation worldwide combined with…
  • Business Cycle
  • Growth momentum
  • Oil Price
READ
  • 2 min

Inflation on the upside in the United Kingdom

  • 16 May 2017
  • Actus & Chroniques

Philippe Waechter

The current acceleration of the inflation rate creates a complex situation in the United Kingdom as it weighs on households’ purchasing power. In April the inflation rate was at 2.7%…
  • Bank of England
  • inflation rate
  • Purchasing Power
READ
Subscribe to the newsletter

All the news from Philippe Waechter’s blog in your mailbox


Loading
ABOUT PHILIPPE WAECHTER

Ostrum's expert magazine

ABOUT OSTRUM AM
  • About us
  • Media room
  • Our publications
  • Cookie Policy (EU)
FOLLOW ME ON
EXTERNAL LINKS
  • Economists
  • Think tank
  • Central banks
  • Blog roll
©Ostrum AM 2022
An affiliate of : Plan de travail 2

Input your search keywords and press Enter.

Manage Cookie Consent
We use cookies to optimize our website and our service.
Functional Always active
The technical storage or access is strictly necessary for the legitimate purpose of enabling the use of a specific service explicitly requested by the subscriber or user, or for the sole purpose of carrying out the transmission of a communication over an electronic communications network.
Preferences
The technical storage or access is necessary for the legitimate purpose of storing preferences that are not requested by the subscriber or user.
Statistics
The technical storage or access that is used exclusively for statistical purposes. The technical storage or access that is used exclusively for anonymous statistical purposes. Without a subpoena, voluntary compliance on the part of your Internet Service Provider, or additional records from a third party, information stored or retrieved for this purpose alone cannot usually be used to identify you.
Marketing
The technical storage or access is required to create user profiles to send advertising, or to track the user on a website or across several websites for similar marketing purposes.
Manage options Manage services Manage vendors Read more about these purposes
View preferences
{title} {title} {title}