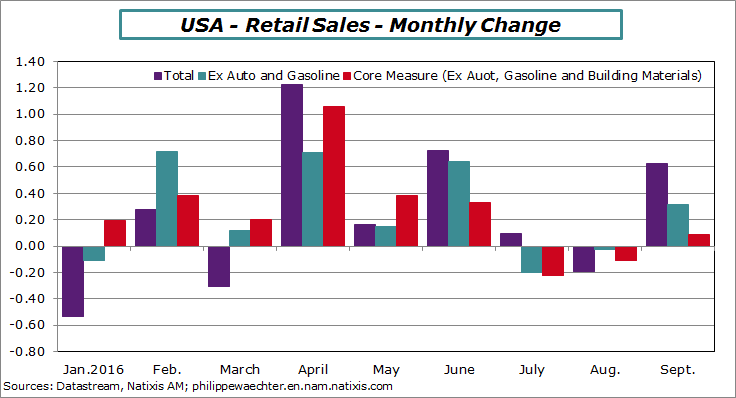
Retail sales were up in September. They increase by 0.6% after a retreat of -0.2% in August and a weak rise (0.1%) in July. On average for the quarter, retail sales are up by 2.9% after 6% during the second quarter. We see the summer change in the graph below. The three measures presented are weaker in July, negative in August and the rise is modest in September
The important measure is the core (in red in the graph above) that is defined as retails sales ex auto, gasoline and building materials. It’s an aggregate that is used to calculate households consumption in national accounts.
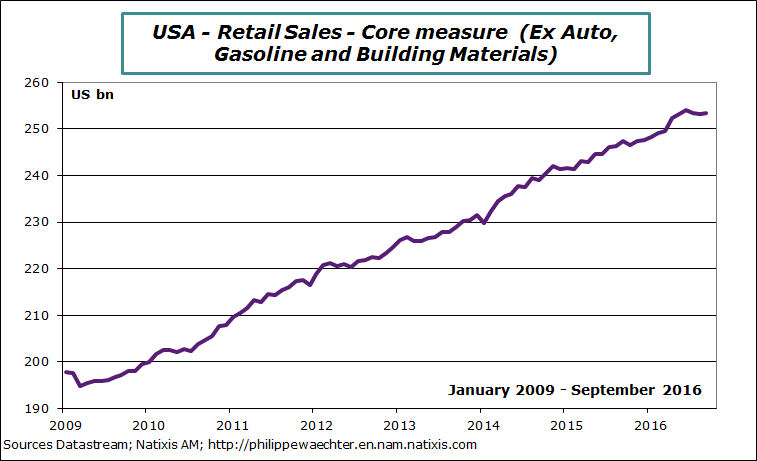
On the second graph below we see a real change in trend since the peak of June.
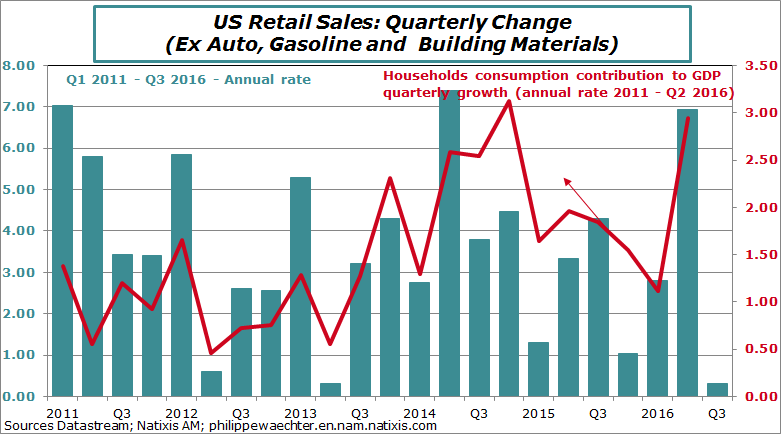
During the last three months it was up only in September. For the third quarter it increased by 0.3% (annual rate) that must be compared to the almost 7% (6.9%) seen during spring. The gap is probably wider when measured in real terms as inflation was a bit higher during the summer period. This was the case in Europe with higher inflation rate in September due to the stabilization of the oil price.
On the third graph below we see the consistency between core retail sales and the households consumption contribution to GDP quarterly growth. We see a very different picture between the second quarter of this year and the third. The retail sales’ carry over growth is below 0.1% for the fourth quarter at the end of September. This is not a good starting signal for the Q4 outlook.
We mustn’t dream. Consumption will not strongly push up GDP growth during the third quarter. Even internal demand will be weaker than in Q2 as investment is still following a low momentum. Net exports and inventories will push growth higher but not too much.

Philippe Waechter's blog My french blog


