Ostrum
  • News & Chronicles
  • France
  • Euro Area
  • United States
  • International
  • Politics & Society
  • Monetary Policy
  • Media
  • Decoding
  • About Philippe Waechter
Philippe Waechter's blog
  • Insights
  • About us
  • Expertise
  • Our people
  • Media

Philippe Waechter's blog
My french blog
  • News & Chronicles
  • France
  • Euro Area
  • United States
  • International
  • Politics & Society
  • Monetary Policy
  • Media
  • Decoding
  • About Philippe Waechter
  • News & Chronicles
  • France
  • Euro Area
  • United States
  • International
  • Politics & Society
  • Monetary Policy
  • Media
  • Decoding
Philippe Waechter's blog
Prévôté
Previous Next
  • 1 min

Is the ISM index a bubble?

  • 5 September 2018
  • Philippe Waechter
  • CFNAI
  • ISM
  • USA
Total
0
Shares
0
0
0

The ISM index for the manufacturing sector is, in August, at its highest since May 2004. It was then at 61.3 versus 61.4 in May 2004.
The reading of this index is puzzling for different reasons
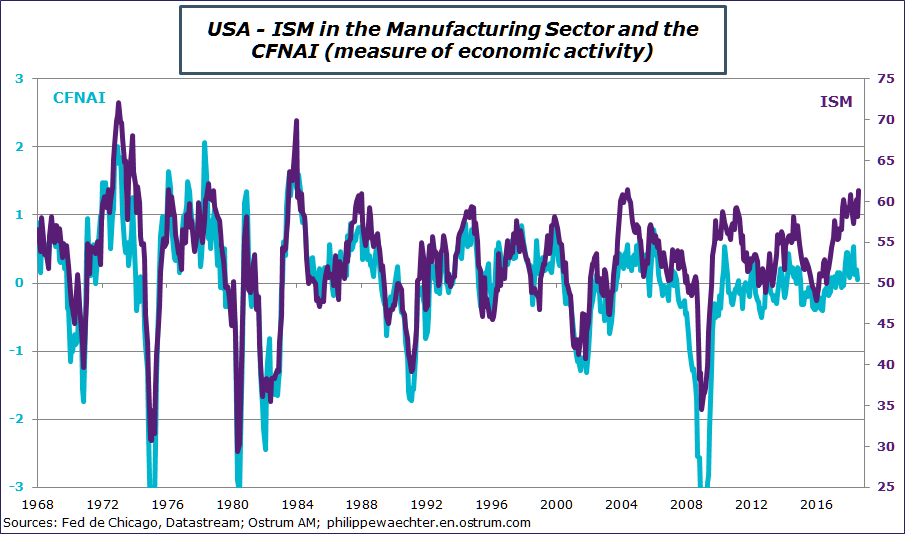
1 – Since 2011, the average growth in the US is 2.2% but the trend was 2.7% between 2000 and 2007. But the ISM index was, on average, higher since 2011 than before the crisis. Its average was 54.1 from January 2011 to August 2018 but only 52.1 from January 2000 to December 2007. A higher ISM index doesn’t not reflect a stronger growth momentum. We can see that also when looking at the manufacturing production index. On the same periods, the annual growth rate was 1.8% from 2000 to 2007 but 1.15% from 2011 to July 2018.
In other words, the index is higher than in the past while growth is lower. 
2 – There is a robust index calculated by the Federal Reserve of Chicago. The CFNAI (Chicago Fed National Activity Index) is the synthesis of 85 indicators (industrial production, employment, personal income,….). It’s reading is easy with an average at zero and a standard deviation of one.
The CFNAI is an accurate measure of the business cycle based on observed variables. Usually the two profiles are consistent as the graph shows.
Recent data show a persistent divergence between the two. The CFNAI is close to 0 while the ISM is at a high historical level. It is probably too high giving a wrong signal of the US growth strength.ismcfnai-summer2018.png

Related Topics
  • CFNAI
  • ISM
  • USA
On the same topic
  • 2 min

The Euro zone slows sharply in March

  • 1 April 2019
  • Actus & Chroniques

Philippe Waechter

The publication March’s Markit indices confirms the downward pressure on activity in the manufacturing sector. The leading indices published for the Euro zone, Germany and France, on March 22, have…
  • Manufacturing Sector
  • Markit
READ
  • 1 min

The shock in the manufacturing sector in Germany: IFO vs Markit

  • 25 March 2019
  • Actus & Chroniques

Philippe Waechter

The modest rebound in the IFO index in March is sometimes interpreted as the counterpoint to the drop of the Markit index released last Friday.There is indeed an opposition in…
  • IFO
  • Manufacturing Sector
  • Markit
READ
  • 1 min

Industrial production shrinks in Euro zone

  • 13 February 2019
  • Actus & Chroniques

Philippe Waechter

With the decline of -0.9% in December, the industrial production of the Euro zone fell by -5.3% over the last quarter (annualized rate). and -2.1% over one year. The slowdown…
  • Euro Area
  • Industrial Production
READ
Subscribe to the newsletter

All the news from Philippe Waechter’s blog in your mailbox

Loading
ABOUT PHILIPPE WAECHTER

Ostrum's expert magazine

ABOUT OSTRUM AM
  • About us
  • Media room
  • Our publications
FOLLOW ME ON
EXTERNAL LINKS
  • Economists
  • Think tank
  • Central banks
  • Blog roll
©Ostrum AM 2021
An affiliate of : Plan de travail 2

Input your search keywords and press Enter.