After a vacation period we all need to look at economic indicators to refresh our perception of the economic outlook. I propose a series of graphs with rapid comments.
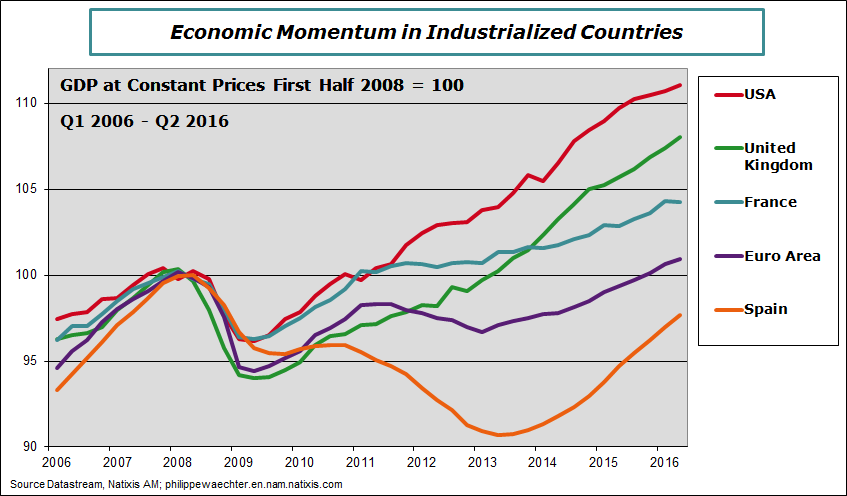
Point #1 – Growth momentum was low in France and in the US during the second quarter.
In France, GDP was marginally down during the second quarter (-0.04% flat and -0.2% at annual rate). In the US, it was up by only 0.3% (flat) (1.2% at annual rate).
For France, this sudden stop is linked to private demand. Its contribution during the first quarter was at 3.6% at annual rate. It was negative at -0.1% during spring. Households’ expenditures slumped with a contribution that was null in Q2 after +2.5% during the first three months of 2016. Corporate investment has had a negative contribution at -0.1% after +1.1% during the first quarter.
The government forecast for 2016 is at 1.5%. It is now an ambitious target as it will be necessary to have a growth number at 0.55% (2.2% at annual rate) during the third and the fourth quarters. We don’t see where this spike would come from. It can work during one quarter, as it was the case during the first quarter of this year, but we cannot expect, for the French economy, two consecutive quarters above its potential growth trend. (for details see here)
In the US, households’ expenditures have shown a strong rebound with a large contribution to GDP quarterly growth (2.9% after 1.1% during the first quarter (at annual rate)). At the same time, the corporate investment was down.
What we clearly notice from US figures is a change in regime since the third quarter of 2015. We clearly see that on the graph below. GDP growth for 2016 will be way below what was seen in 2014 and 2015 where the growth rate was 2.4% and 2.6% respectively. The carry over growth is just 1% for 2016 at the end of the second quarter. To converge to 1.5% it will be necessary to have 2.4%, at annual rate, in the third and the fourth quarters. Growth will be close to 1.5% and it’s a change in regime. This was seen also in the fact that during the second quarter the rebound was not as strong as it used to be during the last five years (see the first graph here)
In Spain and in the UK the momentum was stronger during spring. Growth (at annual rate) was at 2.8% in Spain and at 2.4% in the United Kingdom. In the Euro Area, there was a deceleration from 2.2% to 1.2%. It was mainly due to a weaker internal demand (households’ expenditures). For these three countries we do not have details; therefore no calculus of contributions.
The table below gives the figures to keep in mind for these 5 countries. Look at the weak carry over in the US but the robustness of Spain.
Point #2 – Rebound in the manufacturing sector in July
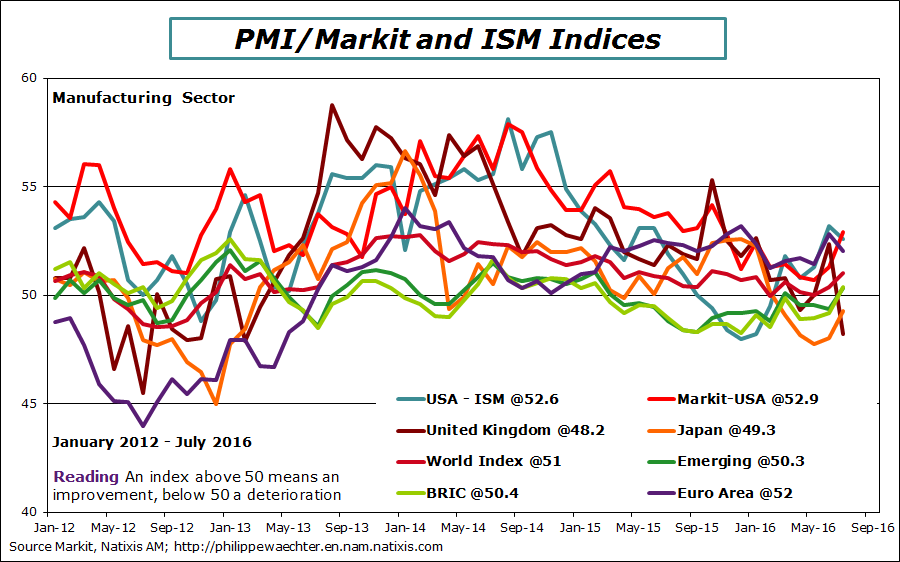
In July the Markit world index for the manufacturing sector was up to 51. It’s clearly above the threshold of 50 that separates expansion (above) and contraction (below 50). This level is the highest since November 2015.
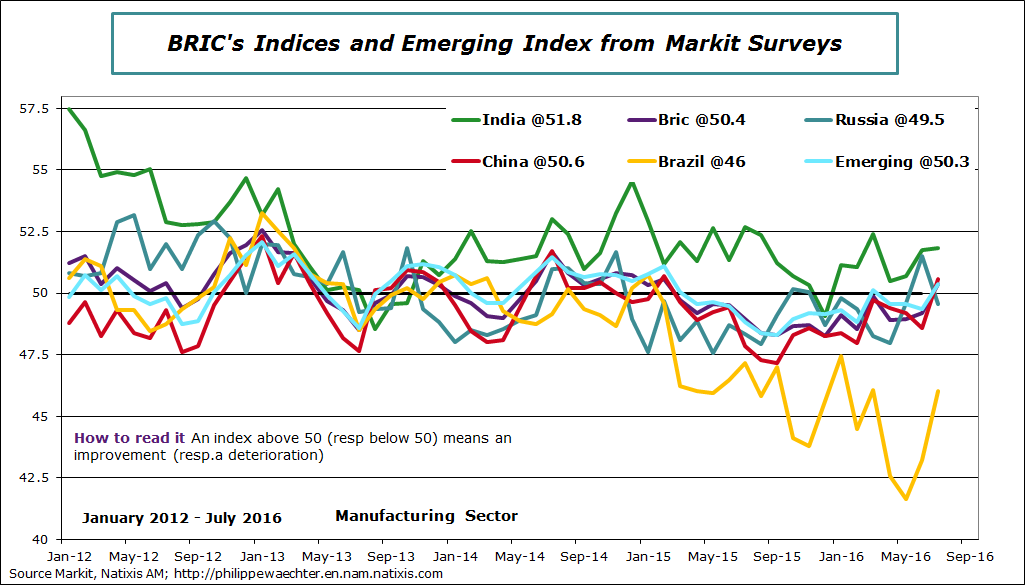
A major explanation of this improvement is in emerging countries. The two indices (emerging and BRIC) have jumped above 50 in July at 50.3 and 50.4 respectively. This reflects the rapid pace seen in China where the index is above 50 It is the first time since February 2015. (In China the rebound is associated with new orders and a stronger momentum on production).
In the US, there is an improvement for the Markit index, not for the ISM. For the ISM the lower momentum for new orders is an explanation. The ratio of New Orders to Inventories is still way above 1 but is trending downward. Erosion is seen in the Euro Area with an index at 52 after 52.8 in June. Improvement in Japan at 49.3 but still in negative territory. The new fiscal strategy presented by Abe in August could improve the current situation.
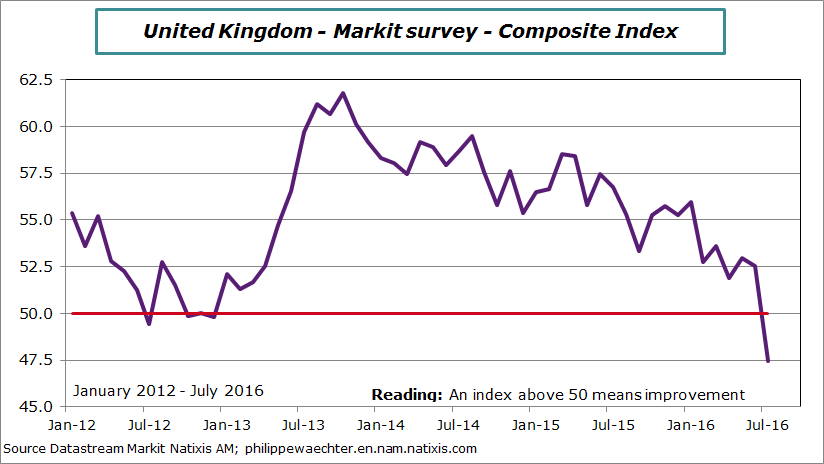
The major point is the drop seen in the UK’s index. It is now at 48.2 for the manufacturing sector but the composite is at only 47.5. This reflects uncertainty after the referendum and highlights the decision taken by the Bank of England to become more accommodative.
Point #3 – The Bank of England reacts
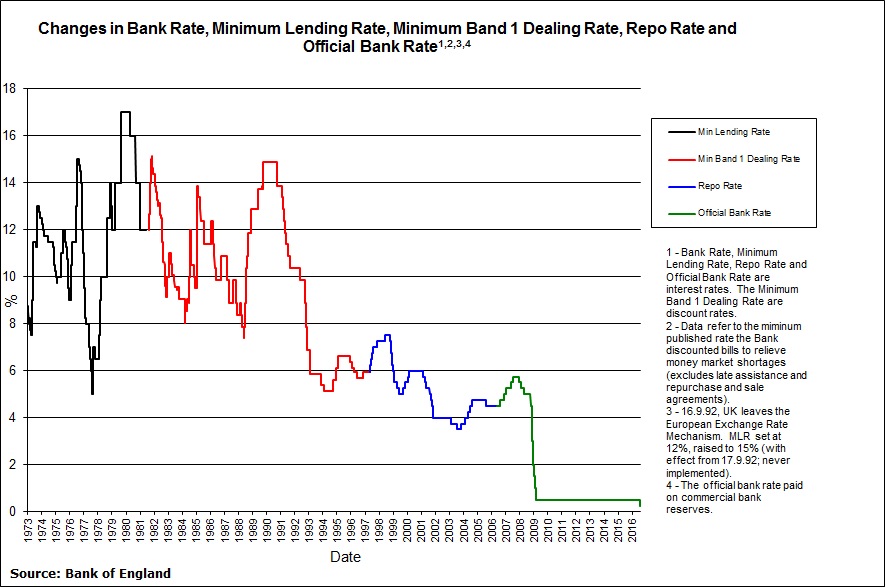
Due to the risk on the economy associated with the Brexit issue, the Bank of England has decided to adopt a more accommodative monetary policy. The BoE main rate is down by 25bp to 0.25%, measures (Term Funding Scheme (TFS)) have been taken to improve the pass-through of this low interest rate on credit preserving banks’ profitability. The last 2 measures are the purchase of corporate bonds for £10bn and the extension of the size of the quantitative easing policy on sovereign bonds by £60bn to £435bn. On this last point, there is a strong imbalance in the market between the BoE strategy and the bonds available. This has led to a downward shift of the UK yield curve. This will continue.
There are three points to keep in mind
1 – The Bank of England doesn’t want to take any risks on the economic activity. Comments on a Brexit Boom linked to the drop of the currency reflects a short term momentum. The BoE prefers to act preventively.
2 – Forecasts on growth are dramatically revised down in 2017 and 2018. A 2% growth in 2016 is consistent with a 0.3% (non annualized) growth in Q3 and Q4. This would imply a carry over growth of circa 0.5% for 2017 at the end of 2016. In 2017 0.8% is expected. This is consistent with 0.1% per quarter (non annualized). There is a mild recovery in 2018 with a GDP growth at 1.8%. In May, before the referendum, forecasts were at 2.3% for both 2017 and 2018. The cost associated with the Brexit is high.
3 – One interesting point is the trade-off in the BoE’s targets. The UK central bankers focus on activity even if this is associated with an inflation dynamics that drive price change above the 2% target (even if the target is 2% +/- %)
The BoE doesn’t make explicitly the strong hypothesis of a recession. If it was the case we can expect new measures from the UK monetary authorities (higher QE).
The main point to keep in mind is the focus on activity that is clearly said in the press release even if inflation surges. The message is that it is not a big deal to go beyond the target of 2%. It’s a change in philosophy among central bankers.
Point #4 – The Federal Reserve will not change its monetary strategyAt its July meeting the US central bank has not changed its main interest rate. It remains in the corridor [0.25; 0.50%]. The main point to notice in the press release is the judgement that the near-term risks have diminished. Headwinds are not as strong as they were in a recent past.
The US central bank doesn’t deliver arguments that could feed a rapid hike in its rate. What is important is that the long term level for the fed funds is now at 3% meaning that the Fed remains worried by the economic environment. Therefore even if there is an increase this year it will not be the beginning of a strong and recurrent movement. (see here)
Point #5 – Robust report on Employment in the US in July
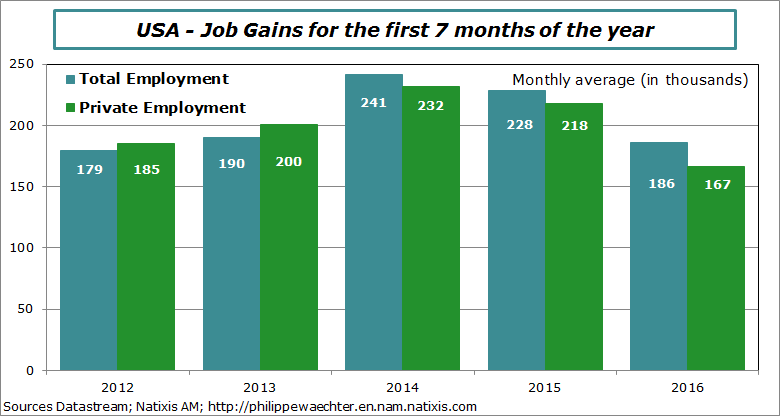
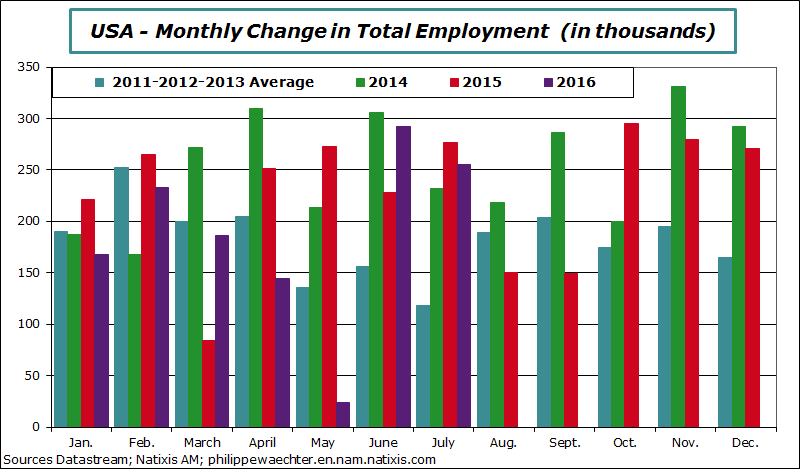
The number of jobs has increased rapidly in July. It was 255 000 after 292 000 in June. Since the beginning of the year, the monthly average is 186 000 which is way below last year average at 228 000 on the same period. The slowdown is easy to see on the graph below.
The month on month comparison shows a strong improvement during the last two, specifically in Business Services which means that companies are on a good shape.
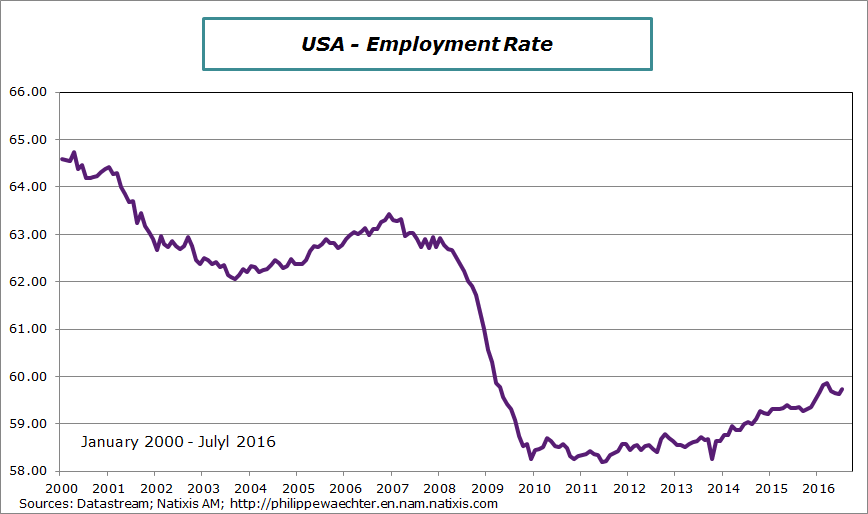
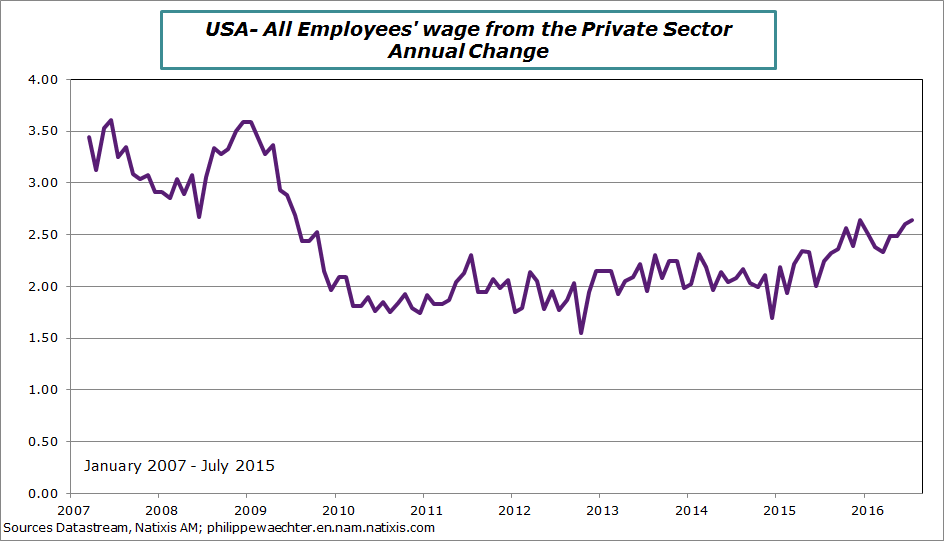
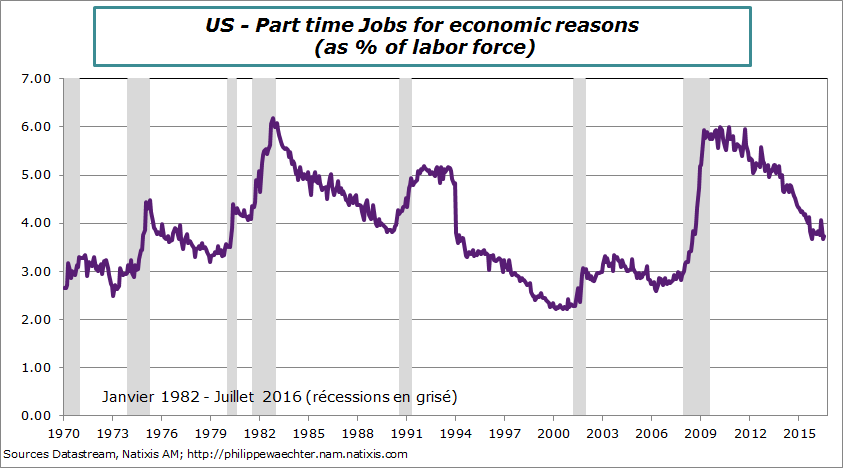
Nevertheless, even with these strong numbers the employment rate doesn’t improve, pressures on wages remain limited even if now the trend is close to 2.5% while it was 2% in a recent past. Moreover part-time jobs are not improving and it is still a high number (that the reason we can say there is not full employment)
These figures will not change the Fed’s view
Point #6 – Proactive fiscal policy in Japan
The monetary strategy of the Bank of Japan is at the end of what was launched at the beginning of 2013. Therefore after the huge mistake of April 2014, the government wants to improve the economic momentum with a strong fiscal policy. The new plan will represent 5.6% of GDP on many years. Discussions and debates at the Parliament will start this fall in order to expect a rapid impact on growth.

Philippe Waechter's blog My french blog


