The stabilization of the oil price around USD 50 implies that the contribution of the energy sector to the inflation rate converges currently to 0.
In October for the Euro Area, this contribution was only -0.09%, its highest number since June 2014. The profile is the same in the US.
The point is simple. The current oil price is comparable to the price seen one year ago. This wasn’t the case since mid-2014. Therefore the energy contribution to the inflation rate was systematically negative as the oil price was lower than a year before. As prices are currently comparable the contribution converges to 0
BUT
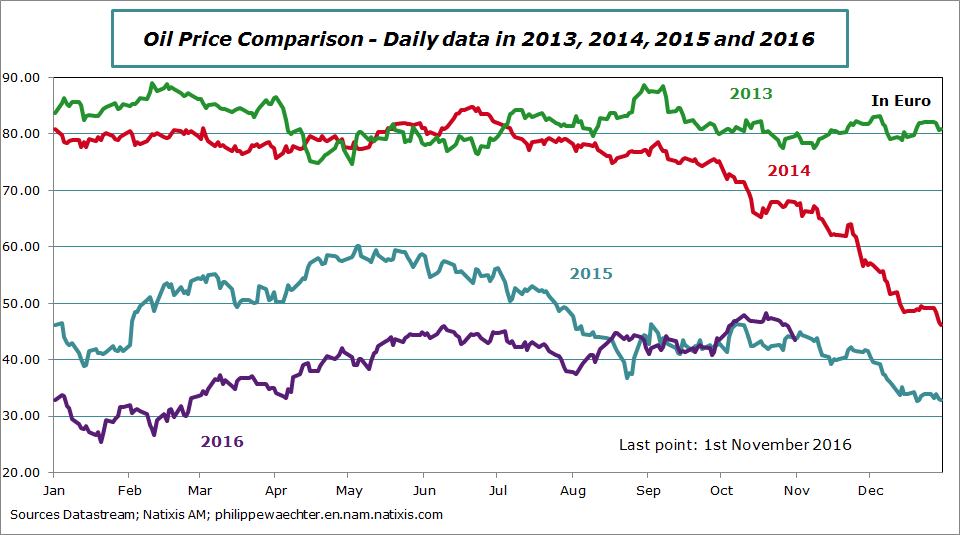
At the beginning of 2016, the price is way below USD 30. This means that in early 2017, the USD 50 price for a barrel will be compared to below 30. This means that the energy sector contribution will jump.
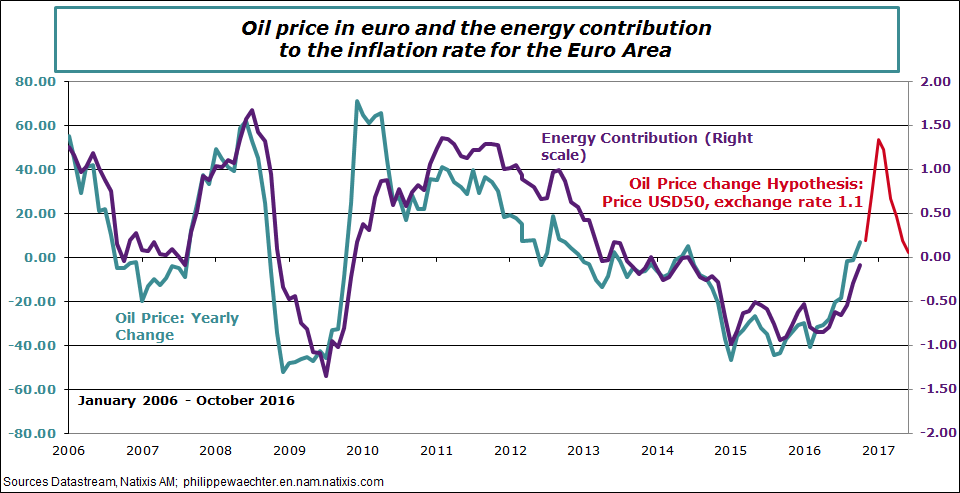
The graph below shows the consistency between the yearly change in oil price and the energy sector contribution to the inflation rate for the Euro Area.
The simple hypothesis of a stable oil price at USD 50 implies that the yearly change will be close to 50 % next January and February. We see this point with the red curve on the graph.
Due to the consistency with the contribution, we can anticipate a contribution that could be close to 1.3-1.4% during the first quarter of next year.
Therefore, if the core inflation rate remains at 0.8%, the inflation rate could converge temporarily to 2%.
As the oil price will not increase in coming months (the OPEC production is at an historical high in October (see here)) the impact will be temporary and the inflation rate will converge to the core inflation rate, below 1%.
As the effect will be temporary, central banks will not change their monetary policy. That’s why I think that the current increase in long term interest rates is transitory.

Philippe Waechter's blog My french blog


