First graph – A lower oil price will drive inflation rates down
With Iran back on the oil market, the price dropped below 30 dollars for a barrel. This could have an important impact on the inflation rate and therefore on monetary policy strategies in Europe and in the US.
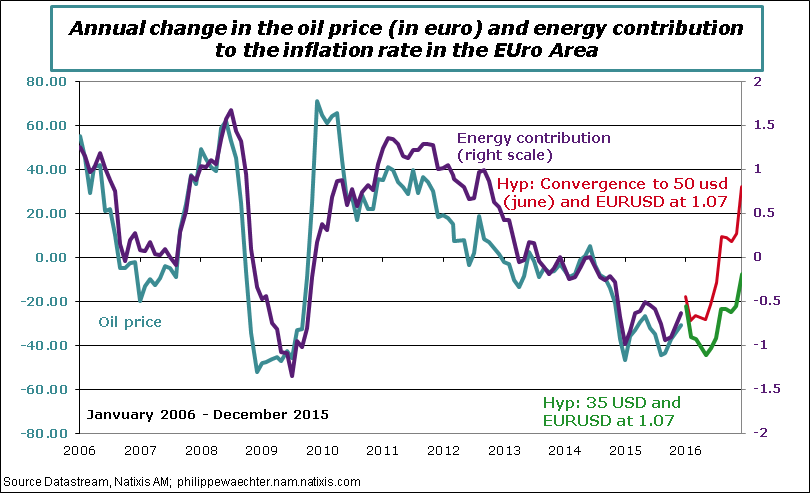
The graph shows, for the Euro Area, the energy contribution to the inflation rate. It also shows the one year change of oil price (Brent) in euro. The two curves have consistent profiles.
With an oil price at 50 and the EURUSD exchange rate at 1.07 (red line), the oil price change is consistent with an energy contribution that could be close to 0 on average in 2016. It was a good hypothesis to put the price at 50. In that case, the headline inflation rate was able to converge to the core inflation rate. It was a comfortable situation for central bankers.
If on average, the oil price is 35 USD and 1.07 (green line), the contribution could be close to -0.6%. In that case, the inflation rate would be circa 0%. With 30 USD and 1.07 it would be probably negative.
These simple calculus show that the oil price trajectory will be important in 2016 (close to 30 or below?) and that there is no guarantee that inflation rates could converge to 2% in a finite time.
The impact will not be too different in the US and in the UK. There will be no strong incentives for monetary authorities to change their monetary policy stance. That’s a first reason to think that the Fed will not be in a hurry to hike its rate rapidly.
Second Graph – Inflation rates are too low in the Euro Area
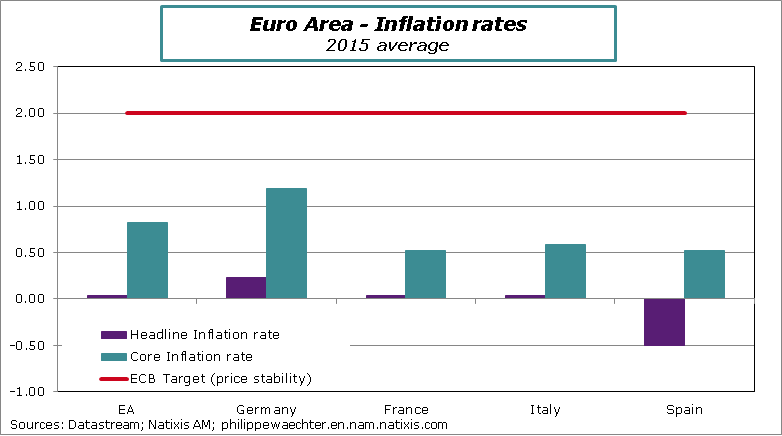
Headline inflation rates for the whole year 2015 are too low in the main Eurozone countries. It is 0% in the Euro Area, France and Italy, at -0.5% in Spain and 0.2% in Germany. Core inflation rates are marginally higher but way below the ECB target at 2%.
The risk of deflation has not vanished and a barrel at 30 dollars could have a dramatic effect. Because beyond prices, this means that there is no wage indexation and no money illusion for consumers. The convergence to a recovery path is not easy in a period of deflation..
Third Graph – Energy and Retails sales in the US
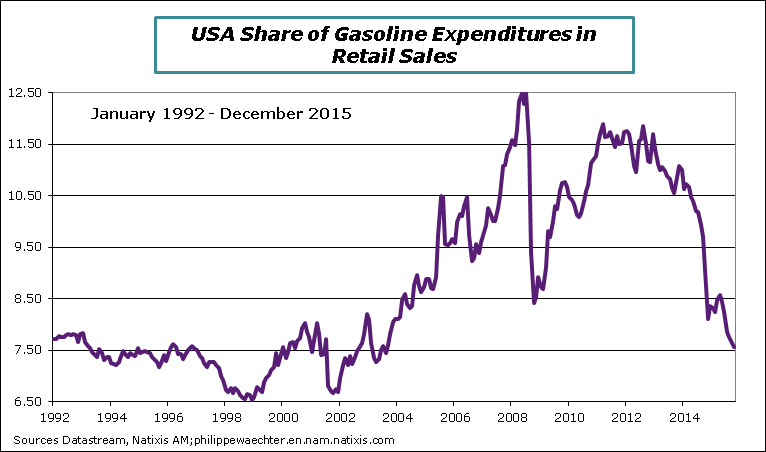
The share of gasoline in retail sales is, in December, at its lowest since the last quarter of 2003. This gives possibilities for consumers to spend more. That’s not what they did at the end of last year.
During the last quarter of 2015, retail sales momentum has slowed rapidly. It has grown by only 0.75% at annual rate versus 4.5% during the third quarter. If we take the control measure (retail less auto, gasoline and building materials) the dynamics is lower at 2.7% versus 4.7% in the three previous months.
In other words even with sales subsidized by a lower oil price, there is no improvement in the expenditure profile. That’s problematic, showing a limited capacity to spend. I think it’s the consequence of a lower share of compensation in the value added and a unbalanced income distribution. The median consumer doesn’t have a lot more to spend
Fourth Graph – The business cycle peak is behind us in the US
Figures for the fourth quarter are weak in the industrial sector. The quarterly change was down by -3.4% at annual rate versus +2.8% during the third quarter. There is behind this slowdown the impact of the lower oil price. But there is already a spillover on the manufacturing sector. This latter is just up by 0.5% in the last three months of 2015 versus 3.2% last summer.
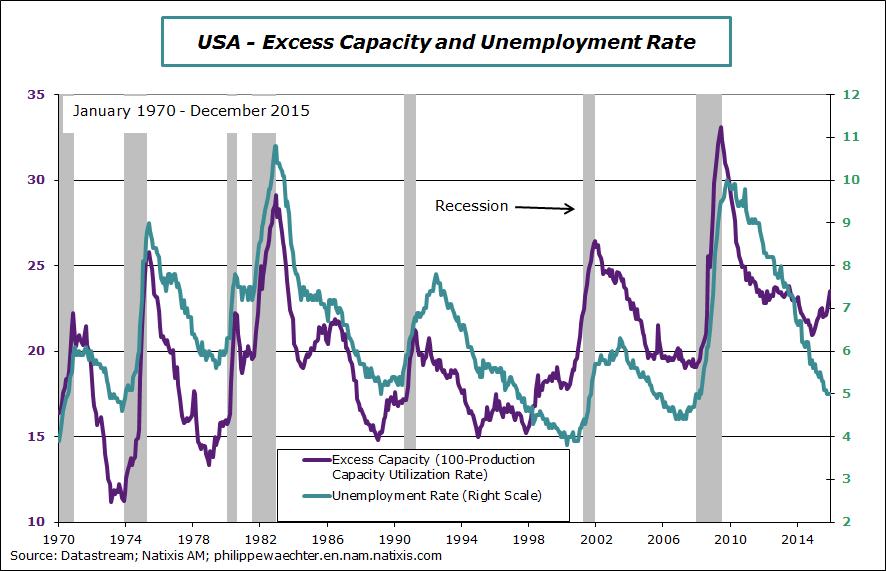
The change in the US momentum can be seen on the next graph. It shows excess capacity and the unemployment rate. We see that excess capacities bottom before the unemployment rate since the mid 80’s.
In 2015, the bottom in excess capacities was seen in January. Since then excess capacity has grown dramatically but it is still consistent with a lower unemployment rate for a moment (the unemployment rate could go lower than 4.5%).
We can expect that the unemployment rate trend will change after next summer. A slowdown doesn’t mean a recession but should the Fed hike again its interest rate? Not sure
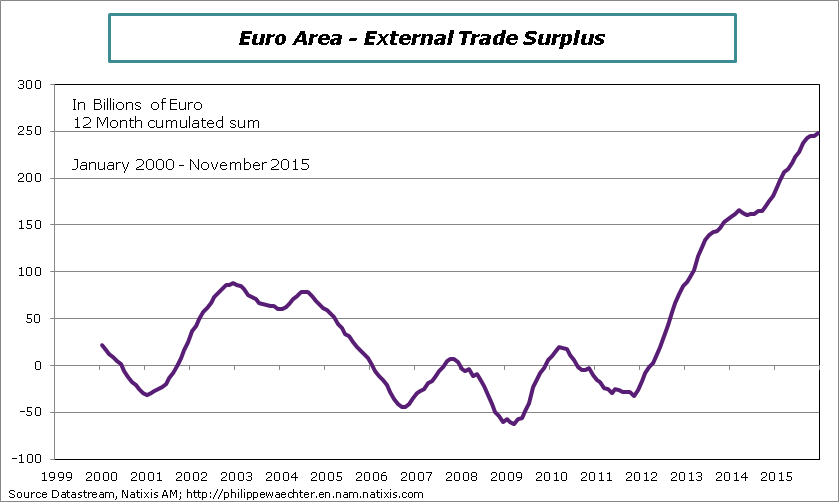
Fifth Graph – External trade surplus is too high in the Euro Area
For the last 12 months, the trade balance surplus was, on average, at EUR 21bn per month. The cumulated figure is EUR 248bn for the last 12 months in November. It’s too much. Exports is just a way for a country to buy products or commodities (imports) it doesn’t produce. A large surplus is useless as it shows that there is too much saving. This is the case for the Euro Area.
Fiscal policy is the only way to reduce this saving, to increase internal demand and at the end to boost the economic activity and employment.
That’s just the application of the economic policy theory which says that the number of instrument must be equal to the number of target. There are two targets (growth and inflation are both too low) and only one instrument (monetary policy). This cannot work and the result is this huge external surplus.
A last remark: one source of the mess we currently see on markets is the fact that the Chinese authorities have accepted that a currency depreciation was the good strategy to increase competitiveness. They accept to signal that monetary and fiscal policies will not be able to boost growth.
China is using the same strategy than Japan and the Euro Area with a currency depreciation. This means that the dollar will stay strong – Still another motive for the Fed to keep its interest rates stable.

Philippe Waechter's blog My french blog


